What's new in flextable 0.9.11
flextable 0.9.11 brings ‘patchwork’ integration to combine tables with plots and Quarto markdown support inside cells with
as_qmd().
Our posts tagged
as_qmd().
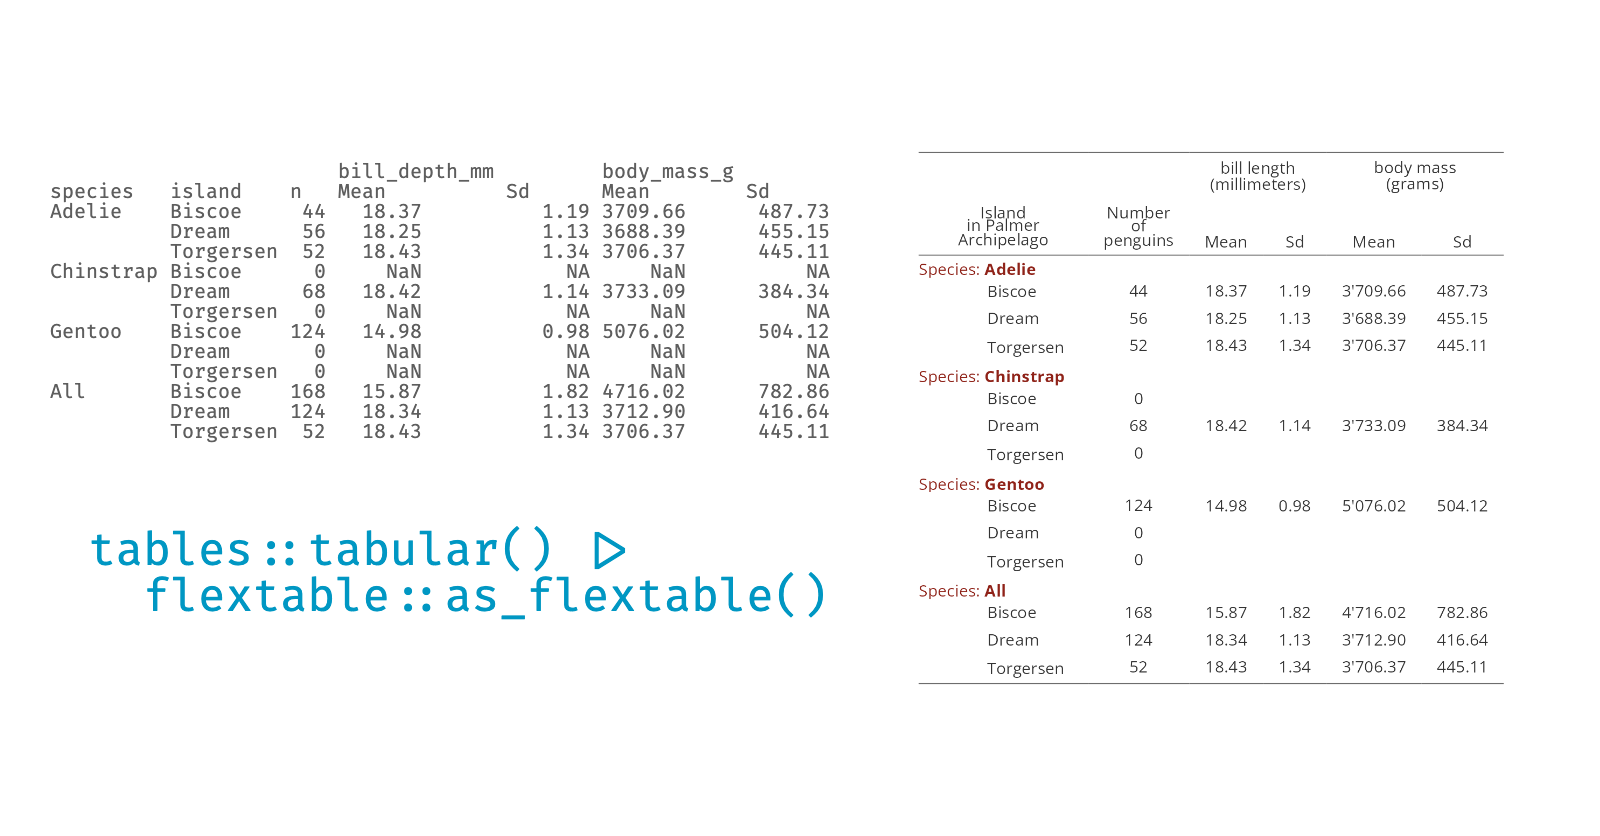
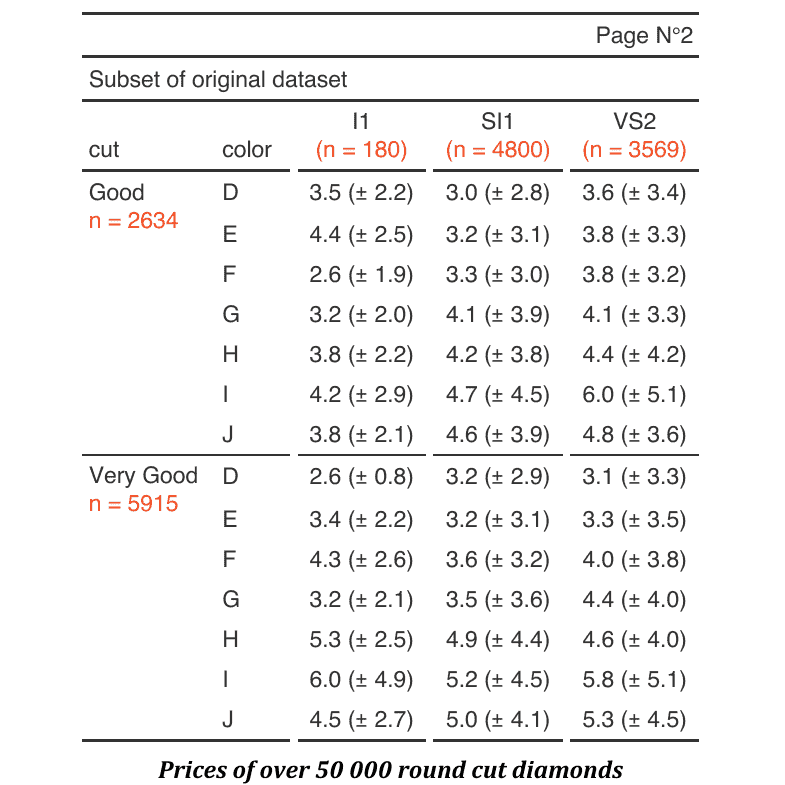
tables::tabular() is the closest thing to the PROC TABULATE in the current R ecosystem. The as_flextable() function of the ‘flextable’ package allows you to obtain a table from the result of tables::tabular() which can then be formatted and integrated into a document of your choice.
The package flextable is existing since mid 2016 and I did not made any
communication about it; obviously if I wrote it, I’d like it to be used by
R users! That post is an attempt to fix that.

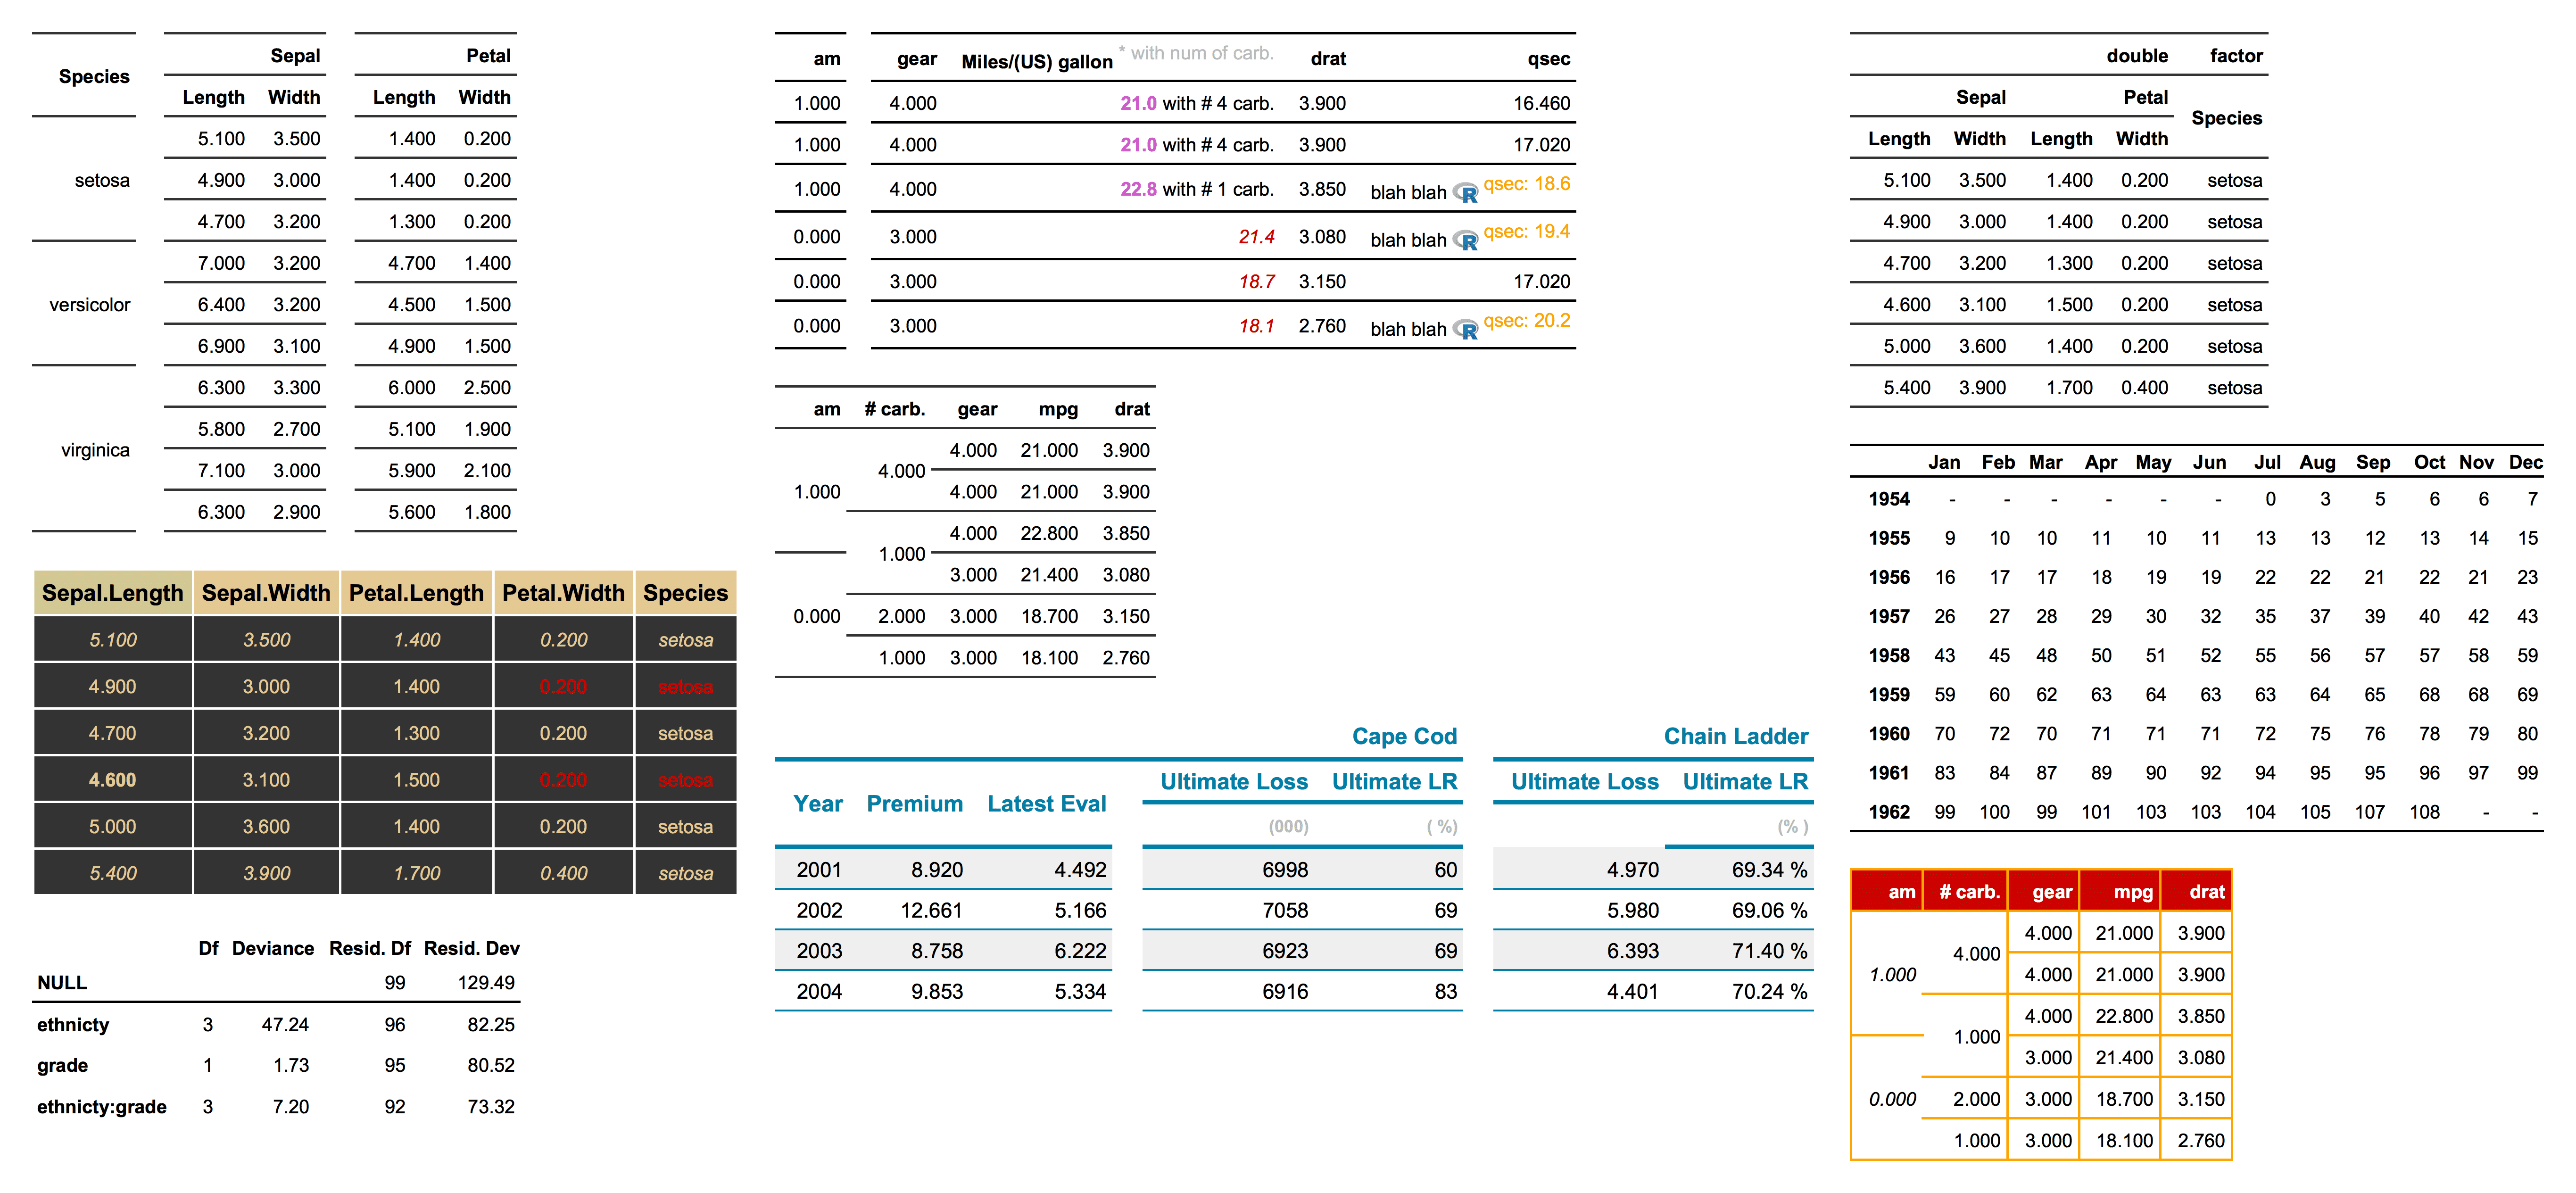
The flextable package makes it simpler to create
tables for reporting purposes. The goal of the package is to provide a set of functions that can
be used to design and format tabular reporting.