Recently, I had to create a small example of a graphic presenting relational data.
As I did not want to use existing data (exercising is always better than copy-pasting), I decided to scrap Zappa discography and musicians; I used to listen to Frank Zappa’s music when I was younger and know that he built a dense universe by collaborating with many good musicians.
Scrapping his discography seemed a good idea to train myself on relationnal data.
Loading lots of packages
The following is loading necessary packages.
library(rvest)
library(xml2)
library(tidyr)
library(dplyr)
library(tibble)
## Warning: le package 'tibble' a été compilé avec la version R 3.5.3library(purrr)
library(ggplot2)
library(tidygraph)
library(ggraph)
library(igraph)
library(ggiraph)
library(flextable)
table_head <- function(x){
ft <- regulartable(head(x))
autofit(ft)
}Scrapping the data
List of Frank Zappa performers
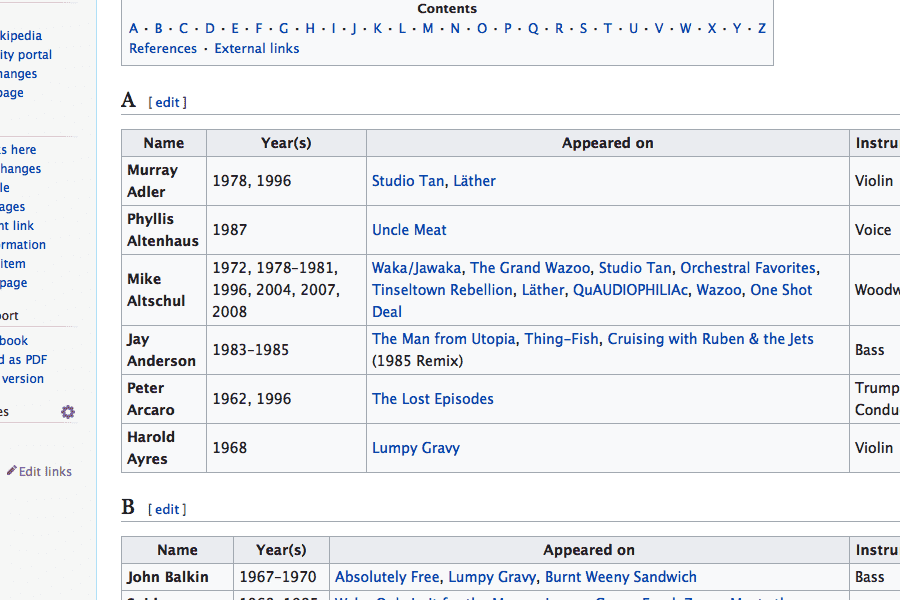
We will scrap a list of performers from wikipedia page here.

Frank Zappa performers wikipedia page
performers <- read_html('https://en.wikipedia.org/wiki/List_of_performers_on_Frank_Zappa_records') %>%
  html_nodes('#mw-content-text > div > table.wikitable') %>%
  map_df( html_table ) %>%
  as_tibble()
table_head(performers)
Name | Year(s) | Appeared on | Instrument |
Murray Adler | 1978, 1996 | Studio Tan, Läther | Violin |
Phyllis Altenhaus | 1987 | Uncle Meat | Voice |
Mike Altschul | 1972, 1978–1981, 1996, 2004, 2007, 2008 | Waka/Jawaka, The Grand Wazoo, Studio Tan, Orchestral Favorites, Tinseltown Rebellion, Läther, QuAUDIOPHILIAc, Wazoo, One Shot Deal | Woodwinds |
Jay Anderson | 1983–1985 | The Man from Utopia, Thing-Fish, Cruising with Ruben & the Jets (1985 Remix) | Bass |
Peter Arcaro | 1962, 1996 | The Lost Episodes | Trumpet, Conductor |
Harold Ayres | 1968 | Lumpy Gravy | Violin |
Frank Zappa discography
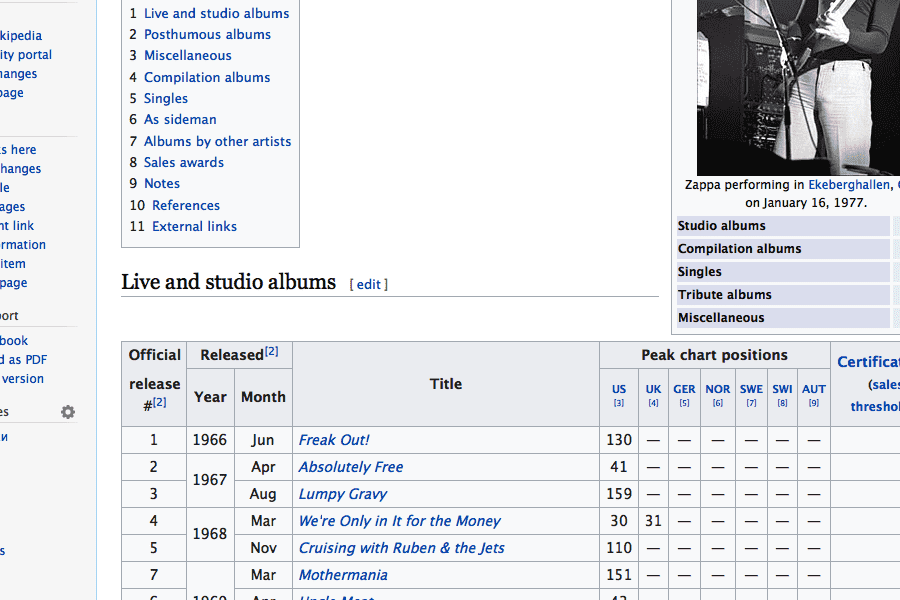
And few details about the discography here. We are only considering live and studio albums.

Frank Zappa discography wikipedia page
discography <- read_html("https://en.wikipedia.org/wiki/Frank_Zappa_discography") %>%
  html_node('#mw-content-text > div > table.wikitable')
xml_remove( discography %>% xml_child("tbody/tr") )

discography <- html_table(discography, fill = TRUE)
discography <- discography[, c(2, 4)] %>%
  set_names(c("year", "album")) %>%
  filter(!grepl("on Stage", album))
table_head(discography)
year | album |
1966 | Freak Out! (with The Mothers of Invention) |
1967 | Absolutely Free (with The Mothers of Invention) |
1967 | Lumpy Gravy (with Abnuceals Emuukha Electric Symphony Orchestra) |
1968 | We're Only in It for the Money (with The Mothers of Invention) |
1968 | Cruising with Ruben & the Jets (with The Mothers of Invention) |
1969 | Mothermania (with The Mothers of Invention) |
Clean our data
There are few annoying data corrections to make the analysis easier later:
- clean album names when there is a comma - the comma will be used to separate album name later.
- change few album names when two or more spelling are used
- drop some specific strings
# manual cleaning ----

clean_album_name <- function(data){
  data$album <- gsub(", Vol.", "- Volume", data$album )
  data$album <- gsub("Civilization, ", "Civilization - ", data$album )
  data$album <- gsub("Overnight", "Over-Nite", data$album )
  data$album <- gsub(" \\(\'\\)", "", data$album )
  data$album <- gsub("\\[1\\]", "", data$album )
  data
}

performers <- rename(performers, musician = "Name", years = `Year(s)`, album = `Appeared on`)

performers <- clean_album_name(performers) %>%
  select(album, musician ) %>%
  separate_rows(album, sep = ", ")
discography <- clean_album_name(discography)
table_head(discography)
year | album |
1966 | Freak Out! (with The Mothers of Invention) |
1967 | Absolutely Free (with The Mothers of Invention) |
1967 | Lumpy Gravy (with Abnuceals Emuukha Electric Symphony Orchestra) |
1968 | We're Only in It for the Money (with The Mothers of Invention) |
1968 | Cruising with Ruben & the Jets (with The Mothers of Invention) |
1969 | Mothermania (with The Mothers of Invention) |
First explorations
We can already perform few quick analysis, i.e.:
how much album have been released each years
count(discography, year) %>%
  ggplot(aes(year, n)) + geom_col()
How many musicians are in each albums?
We are using a semi_join to subset our album list.
performers <- performers %>%
  semi_join(discography, by = "album")
table_head(performers)
album | musician |
Studio Tan | Murray Adler |
Waka/Jawaka | Mike Altschul |
Studio Tan | Mike Altschul |
Orchestral Favorites | Mike Altschul |
The Man from Utopia | Jay Anderson |
Thing-Fish | Jay Anderson |
Frank Zappa was often collaborating with 10 musicians at least per album.
count(performers, album) %>%
  ggplot(aes(album, n)) + geom_point() +
  geom_segment(aes(xend = album, yend = 0)) +
  theme(axis.text.x = element_text(angle = 90, hjust = 1))
musician_entities <- performers %>%
  transmute(name=musician, entity="musician") %>%
  distinct()

album_entities <- performers %>%
  left_join(discography, by = "album") %>%
  transmute(name=album, entity="album") %>%
  distinct()


entities <- bind_rows(musician_entities, album_entities) %>%
  mutate(id = seq_along(entity))
edges <- entities %>%
filter(entity %in% "album") %>%
select(-entity) %>% rename(to = id, album = name) %>%
right_join(performers, by = c("album" = "album"))
edges <- entities %>%
filter(entity %in% "musician") %>%
select(-entity) %>% rename(from = id, musician = name) %>%
right_join(edges, by = c("musician" = "musician"))
edges <- edges %>% select(from, to, musician, album)entities_df <- entities %>%
select(id, name, entity) %>%
rename(type=entity) net <- graph_from_data_frame(d=edges, vertices=entities_df, directed=T)
ggraph(net) +
geom_edge_fan(alpha = .8, edge_width = 0.2, edge_colour= "gray") +
geom_point(aes(x, y, fill = type ), colour="black", stroke = 1, shape = 21, size = 4 ) +
theme_graph(background="#FFFFFF") + theme(legend.position = "none") +
scale_fill_manual(values = c("album" = "black", "musician" = "#006699")) +
scale_alpha_continuous(range = c(0.4, 0.75))## Using `nicely` as default layout
