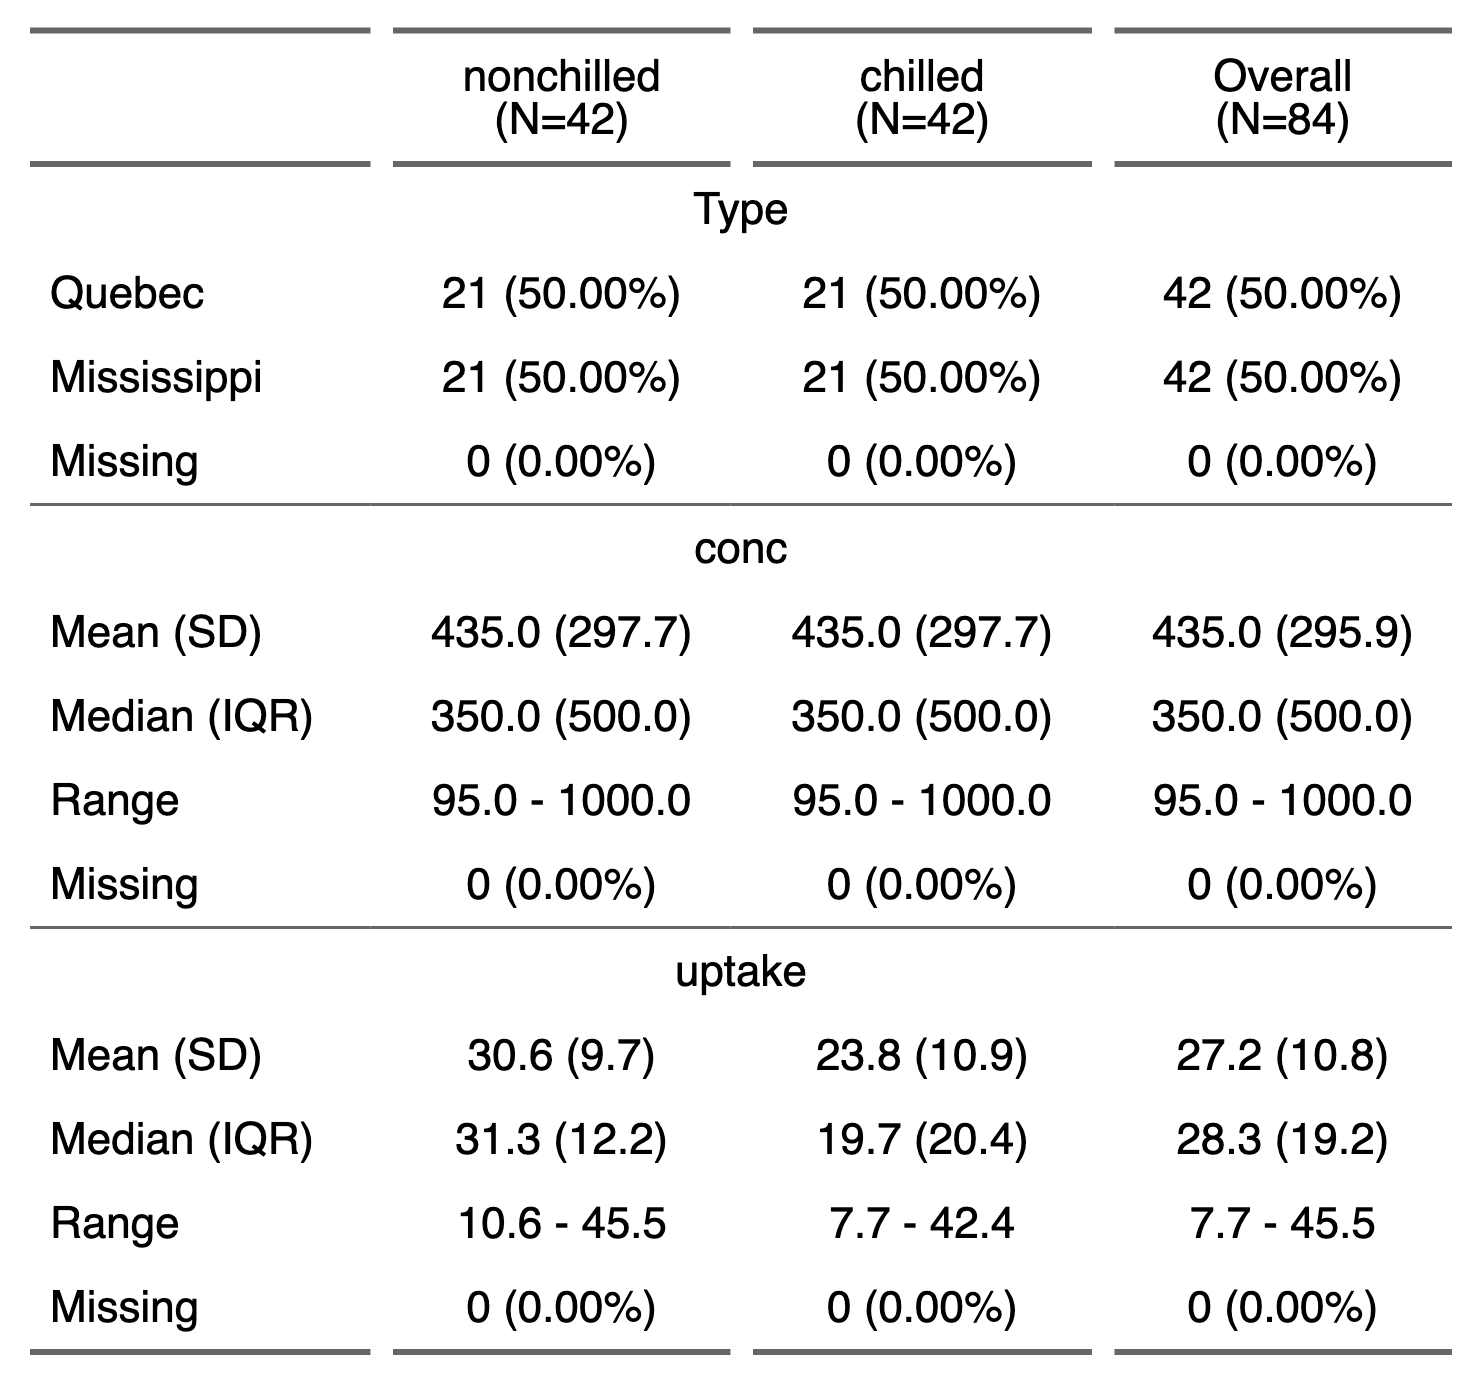
Résumé statistique avec summarizor
Cet exemple montre comment créer un tableau présentant un résumé statistique des colonnes d’un data.frame avec la fonction summarizor().
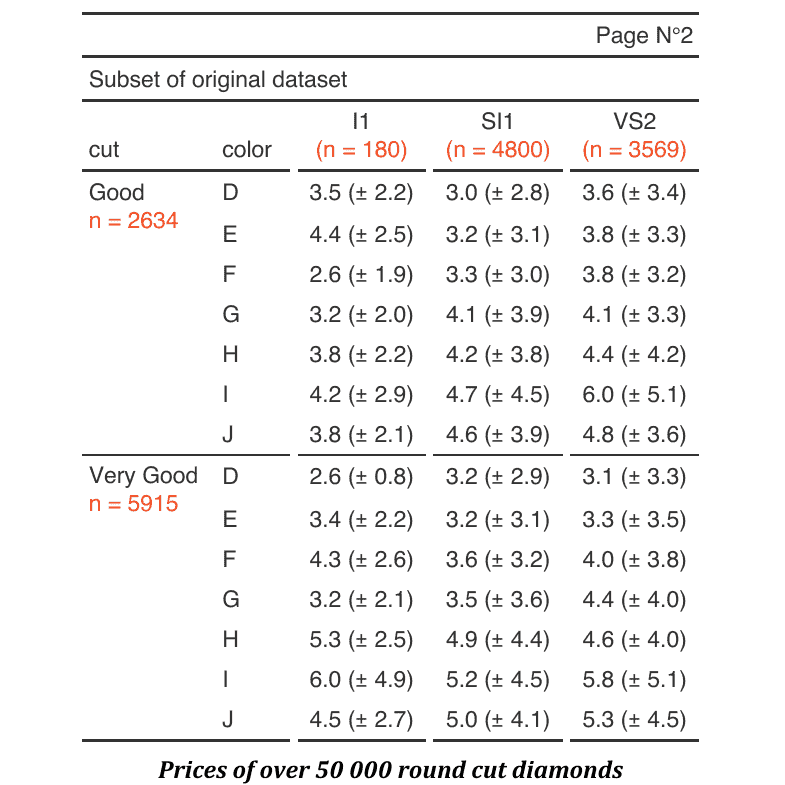
Présenter les agrégations sous forme de tableaux croisés
Comment créer un joli tableau croisé flextable à partir d’agrégations. Cet exemple montre comment utiliser la fonction tabulator().
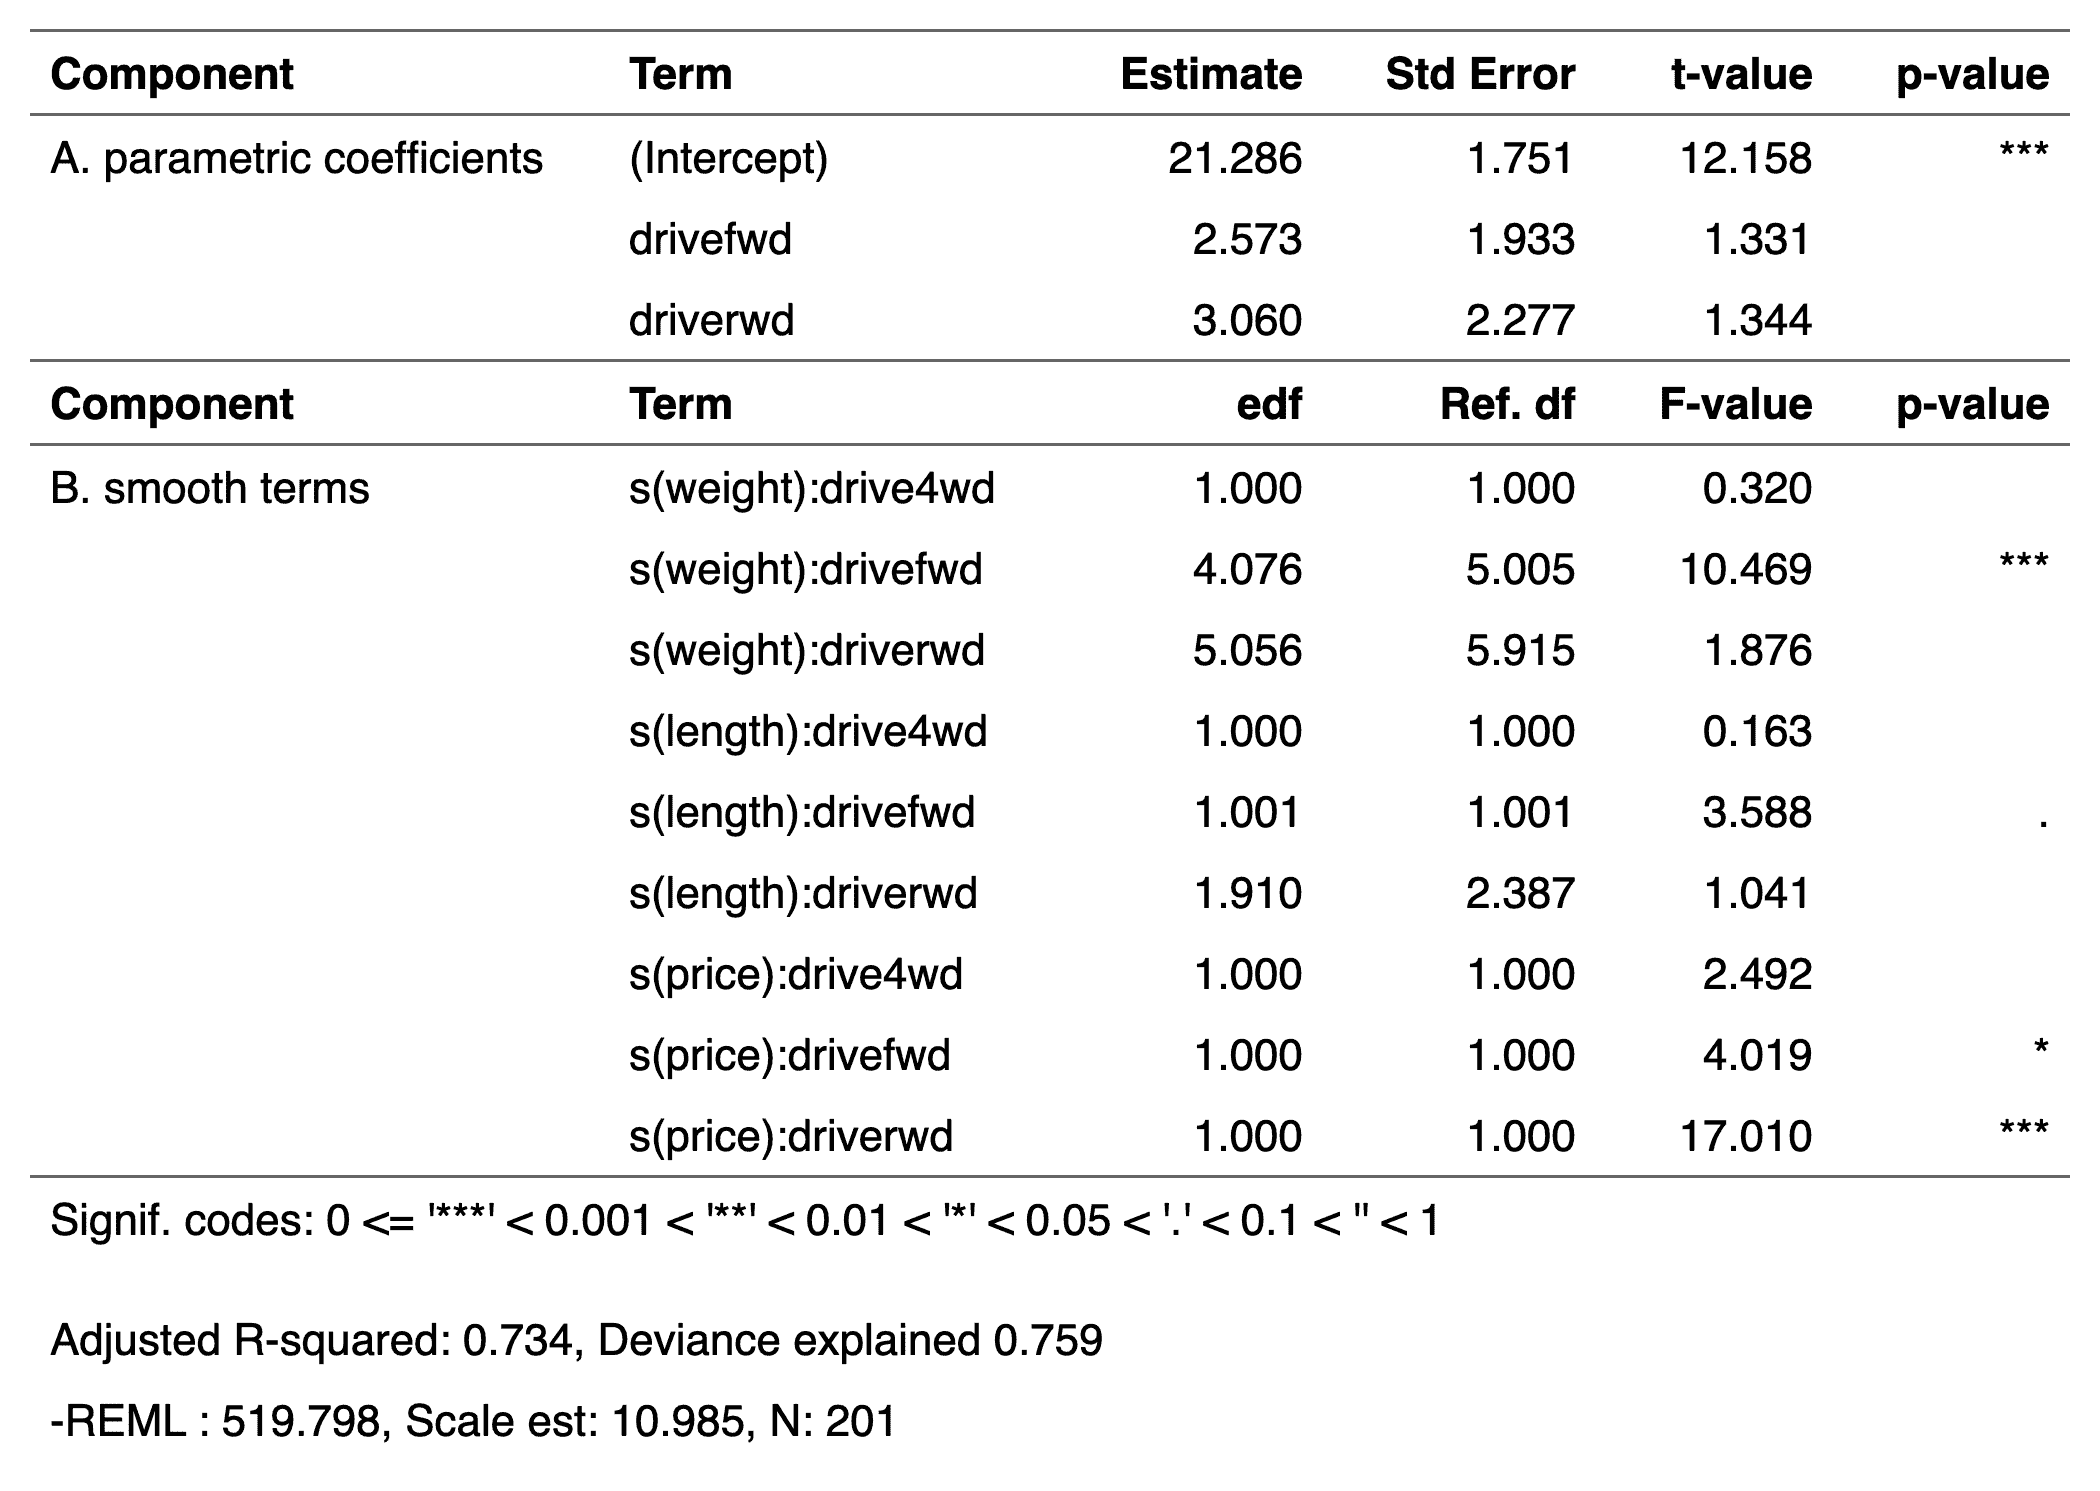
GAM model
Comment produire un flextable à partir d’un modèle GAM avec la fonction as_flextable.
captions examples
Comment ajouter des captions ou titres de tableaux aux flextables produits dans un document R Markdown. These examples demonstrate various methods.
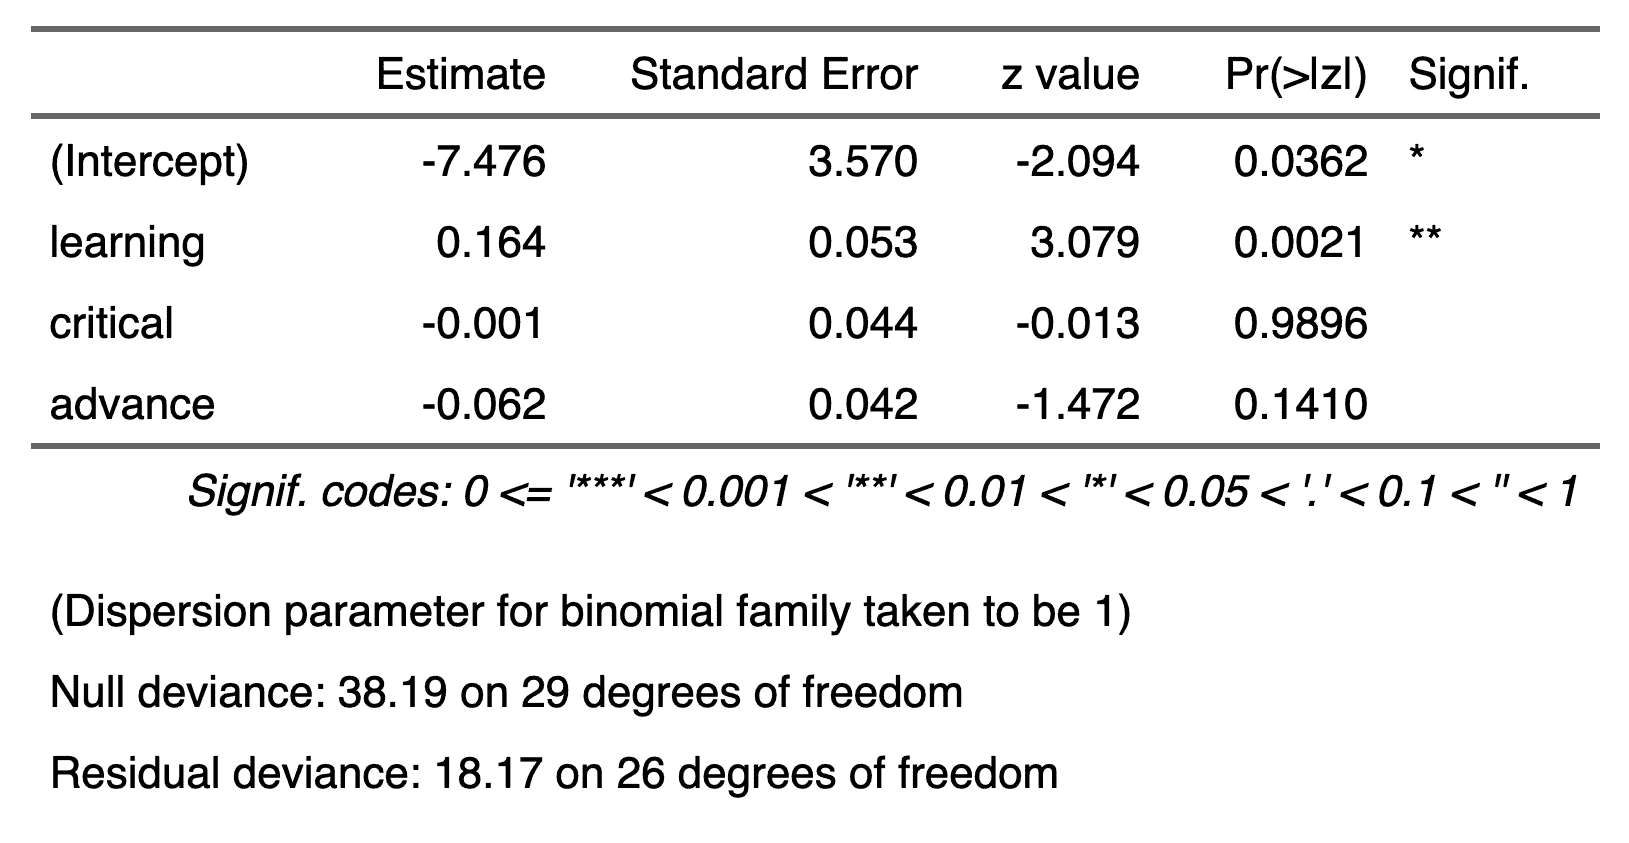
GLM model
Cet exemple illustre la création un flextable à partir d’un modèle GLM avec un appel simple à as_flextable.