Les packages chargés
library(flextable)
library(data.table)
library(scales)
Les données utilisées
On reproduit ici un cas qu’un utilisateur a soummis pour obtenir de l’aide.
Les données sont les suivantes :
cancer_data <- fread("Cancer.dat")
cancers <- dcast(cancer_data, formula = time ~ histology + stage,
                         fill = 0, value.var = "count", fun.aggregate = sum)
cancers
## time 1_1 1_2 1_3 2_1 2_2 2_3 3_1 3_2 3_3
## 1: 1 9 12 42 5 4 28 1 1 19
## 2: 2 2 7 26 2 3 19 1 1 11
## 3: 3 9 5 12 3 5 10 1 3 7
## 4: 4 10 10 10 2 4 5 1 1 6
## 5: 5 1 4 5 2 2 0 0 0 3
## 6: 6 3 3 4 2 1 3 1 0 3
## 7: 7 1 4 1 2 4 2 0 2 3Les valeurs associées aux labels sont les suivantes :
cancers_header <- data.frame(
  col_keys = c("time", "1_1", "2_1", "3_1",
               "1_2", "2_2", "3_2",
               "1_3", "2_3","3_3"),
  line2 = c("Follow-up", rep("I", 3), rep("II", 3), rep("III", 3)),
  line3 = c("Follow-up", rep(c("1", "2", "3"), 3))
)
cancers_header
## col_keys line2 line3
## 1 time Follow-up Follow-up
## 2 1_1 I 1
## 3 2_1 I 2
## 4 3_1 I 3
## 5 1_2 II 1
## 6 2_2 II 2
## 7 3_2 II 3
## 8 1_3 III 1
## 9 2_3 III 2
## 10 3_3 III 3Préparation de la fonction de coloriage
Le package ‘scales’ permet de créer des fonctions pour le coloriage qui peuvent être utilisées avec ‘ggplot2’ mais aussi avec d’autres packages comme ‘flextable’.
colourer <- col_numeric(
  palette = c("transparent", "red"),
  domain = c(0, 50))
Le flextable initial
Voici le premier tableau. Il n’est pas soigné.
ft <- flextable( cancers, col_keys = cancers_header$col_keys)
fttime | 1_1 | 2_1 | 3_1 | 1_2 | 2_2 | 3_2 | 1_3 | 2_3 | 3_3 |
1 | 9 | 5 | 1 | 12 | 4 | 1 | 42 | 28 | 19 |
2 | 2 | 2 | 1 | 7 | 3 | 1 | 26 | 19 | 11 |
3 | 9 | 3 | 1 | 5 | 5 | 3 | 12 | 10 | 7 |
4 | 10 | 2 | 1 | 10 | 4 | 1 | 10 | 5 | 6 |
5 | 1 | 2 | 0 | 4 | 2 | 0 | 5 | 0 | 3 |
6 | 3 | 2 | 1 | 3 | 1 | 0 | 4 | 3 | 3 |
7 | 1 | 2 | 0 | 4 | 4 | 2 | 1 | 2 | 3 |
Le flextable final
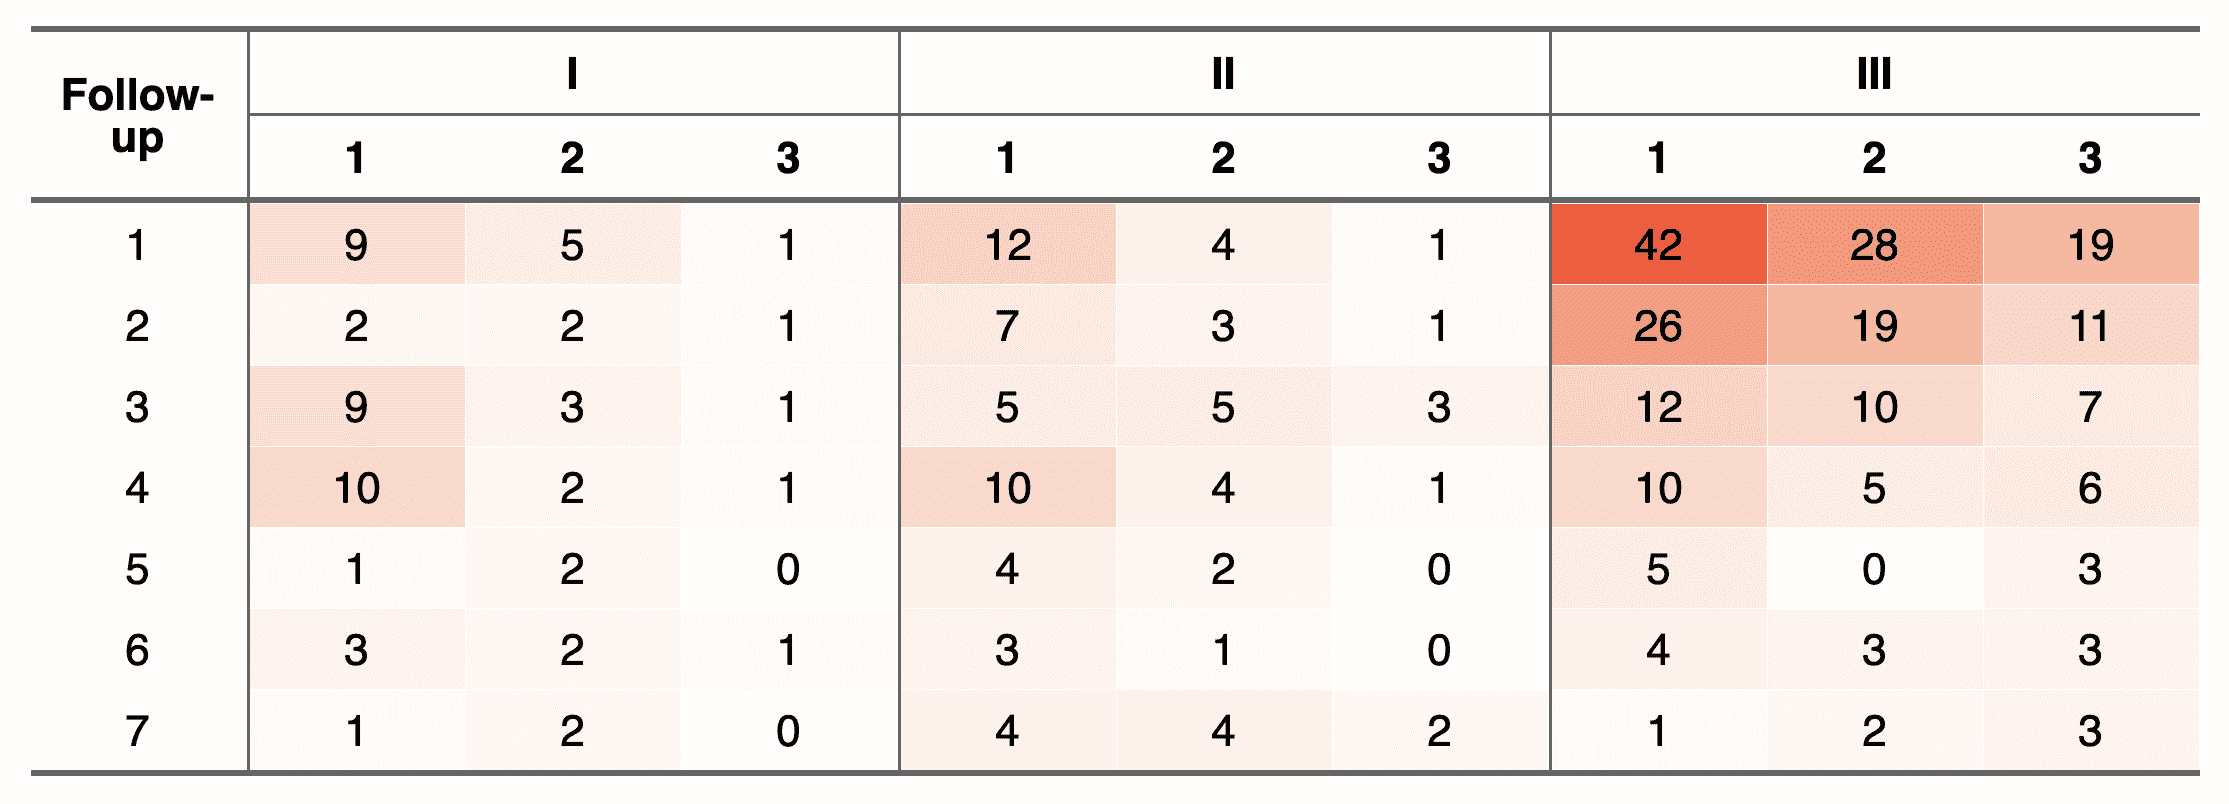
On va ajouter les entêtes, le personnaliser un peu et surtout
on va utiliser la fonction bg() qui peut utiliser notre fonction
comme argument.
ft <- set_header_df( ft, mapping = cancers_header, key = "col_keys" ) |>
  merge_v(part = "header", j = 1) |>
  merge_h(part = "header", i = 1) |>
  theme_booktabs(bold_header = TRUE) |>
  align(align = "center", part = "all") |>
  bg(
    bg = colourer,
    j = ~ . -time,
    part = "body") |>
  vline(j = c(1, 4, 7), border = fp_border_default())
ftFollow-up | I | II | III | ||||||
1 | 2 | 3 | 1 | 2 | 3 | 1 | 2 | 3 | |
1 | 9 | 5 | 1 | 12 | 4 | 1 | 42 | 28 | 19 |
2 | 2 | 2 | 1 | 7 | 3 | 1 | 26 | 19 | 11 |
3 | 9 | 3 | 1 | 5 | 5 | 3 | 12 | 10 | 7 |
4 | 10 | 2 | 1 | 10 | 4 | 1 | 10 | 5 | 6 |
5 | 1 | 2 | 0 | 4 | 2 | 0 | 5 | 0 | 3 |
6 | 3 | 2 | 1 | 3 | 1 | 0 | 4 | 3 | 3 |
7 | 1 | 2 | 0 | 4 | 4 | 2 | 1 | 2 | 3 |
