tabular and flextable
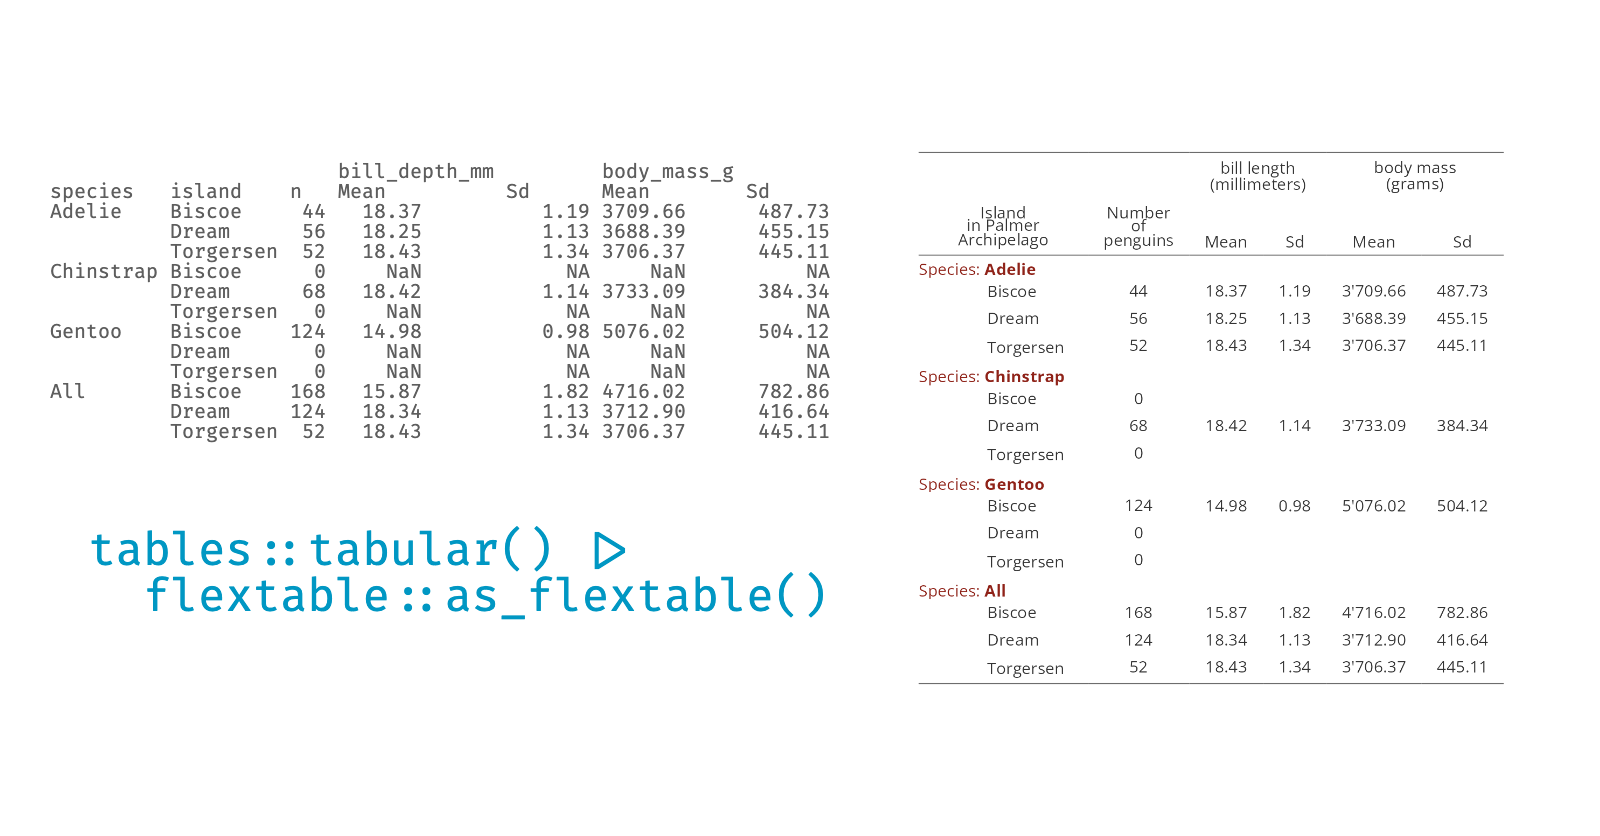
tables::tabular() is the closest thing to the PROC TABULATE in the current R ecosystem. The as_flextable() function of the ‘flextable’ package allows you to obtain a table from the result of tables::tabular() which can then be formatted and integrated into a document of your choice.
2023/04/07
flextable supports RTF
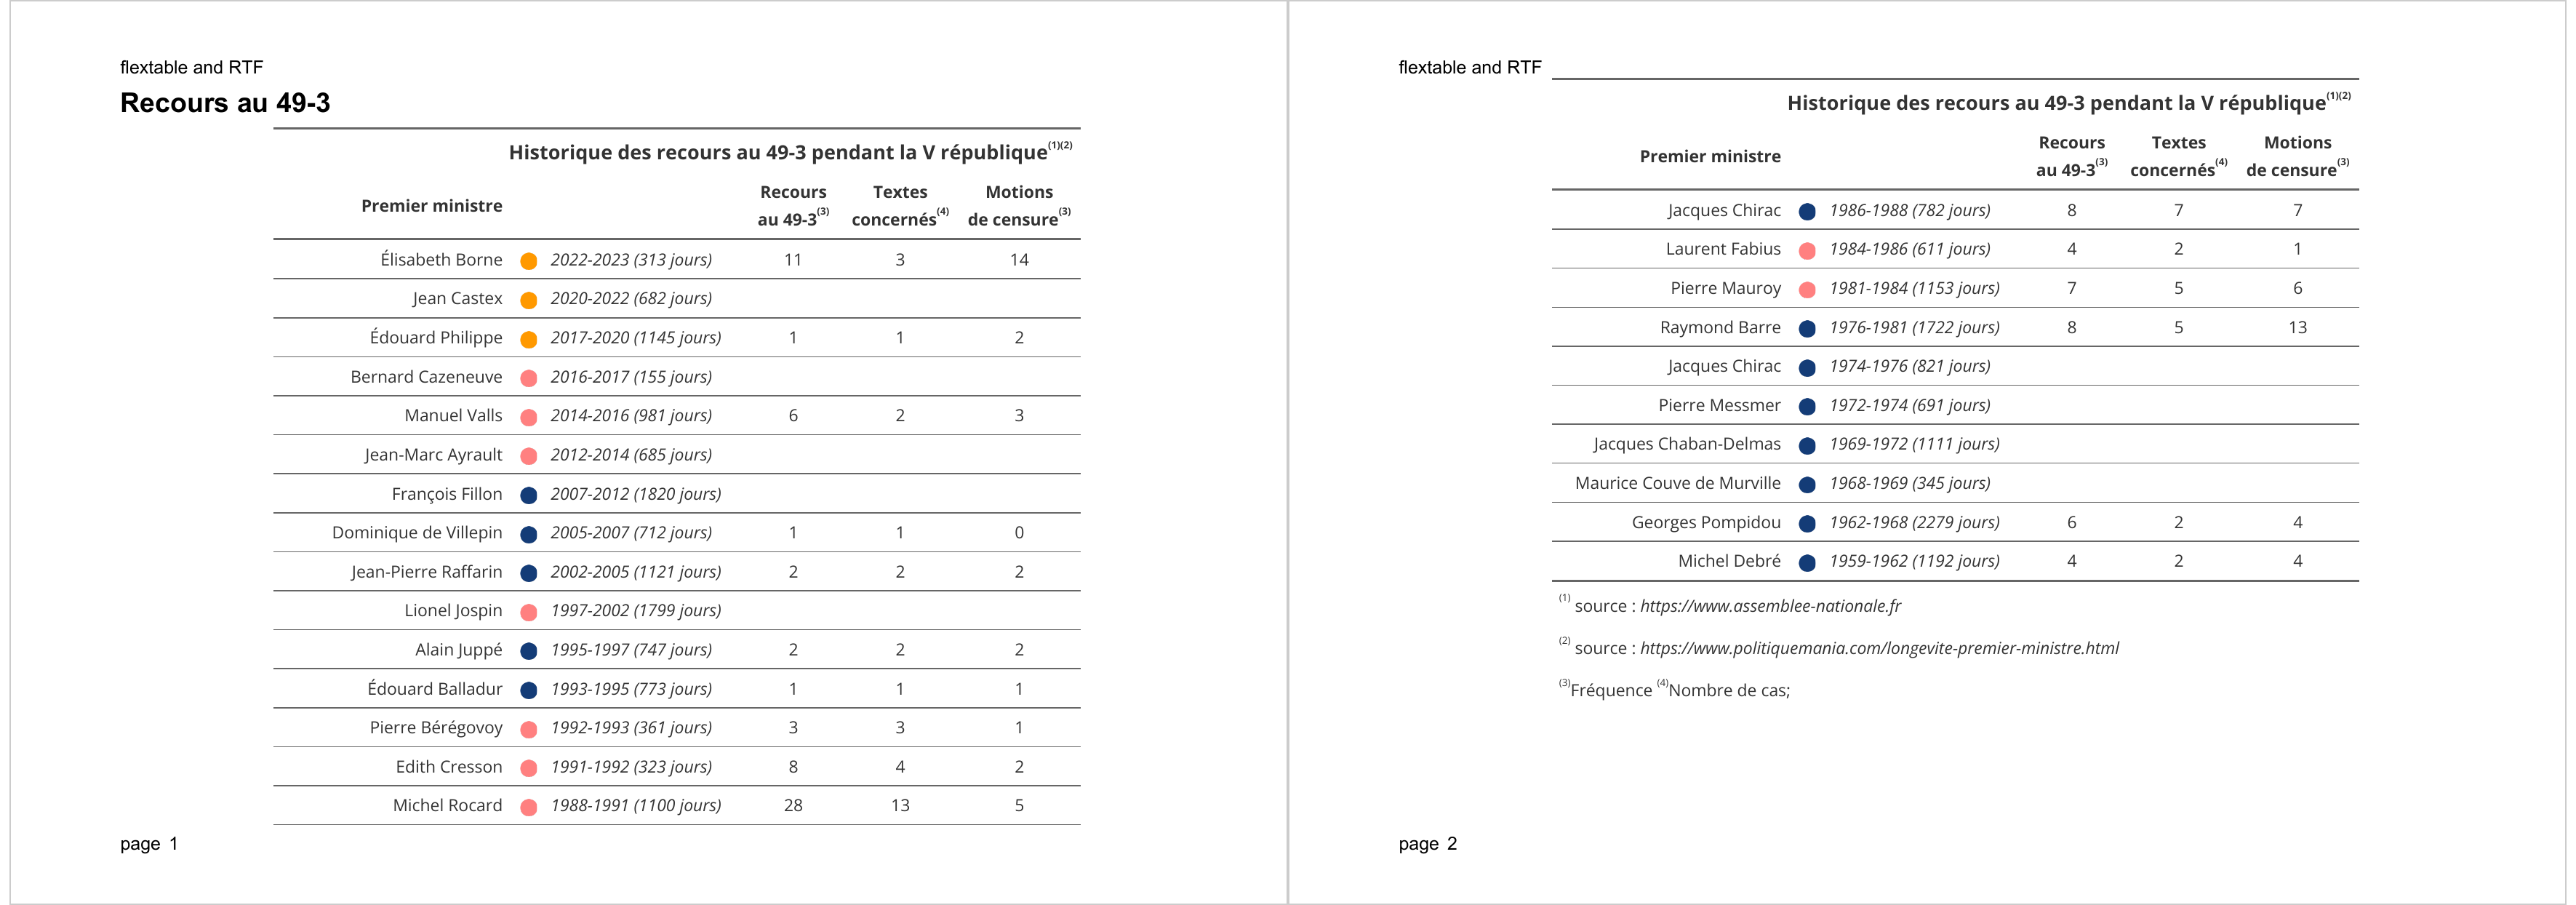
The post presents the new RTF output supported by the ‘flextable’ package and shows an illustrated example.
2023/04/05
flextable for 'Grid graphics'
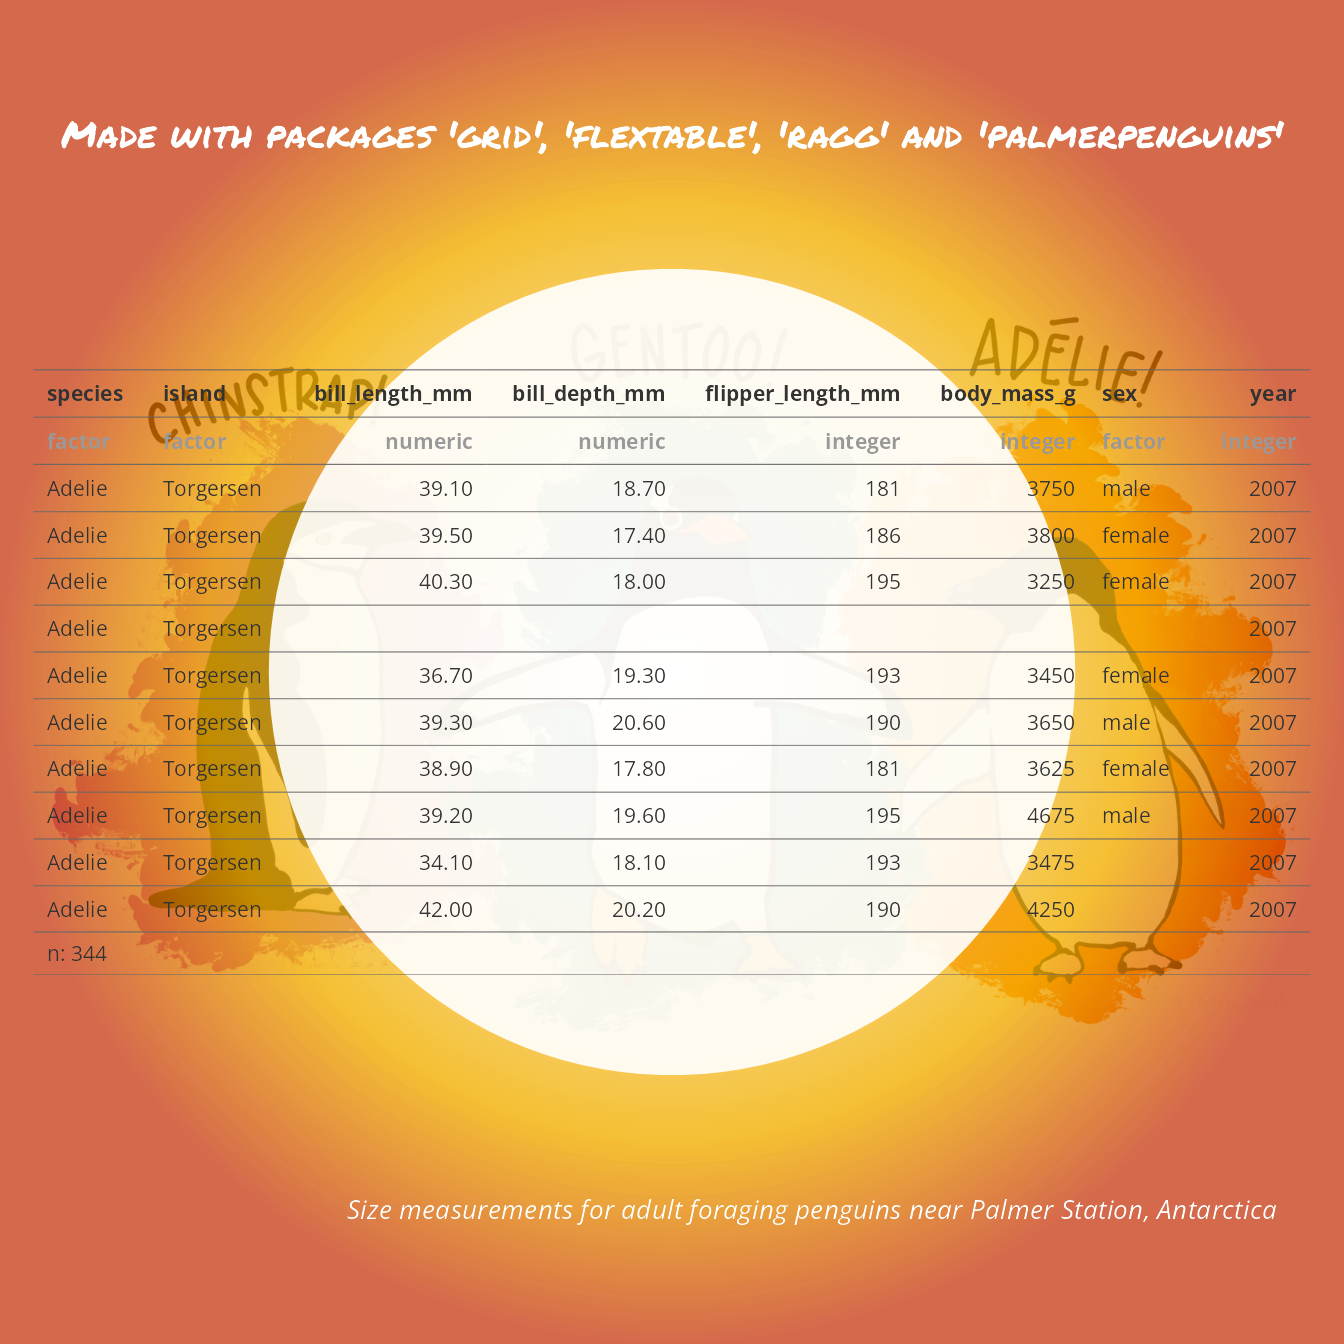
In this article we present the graphic output generated by flextable and how to take advantage of it with ‘ggplot2’ or ‘grid’.
2023/04/03
Word documents update from R with doconv
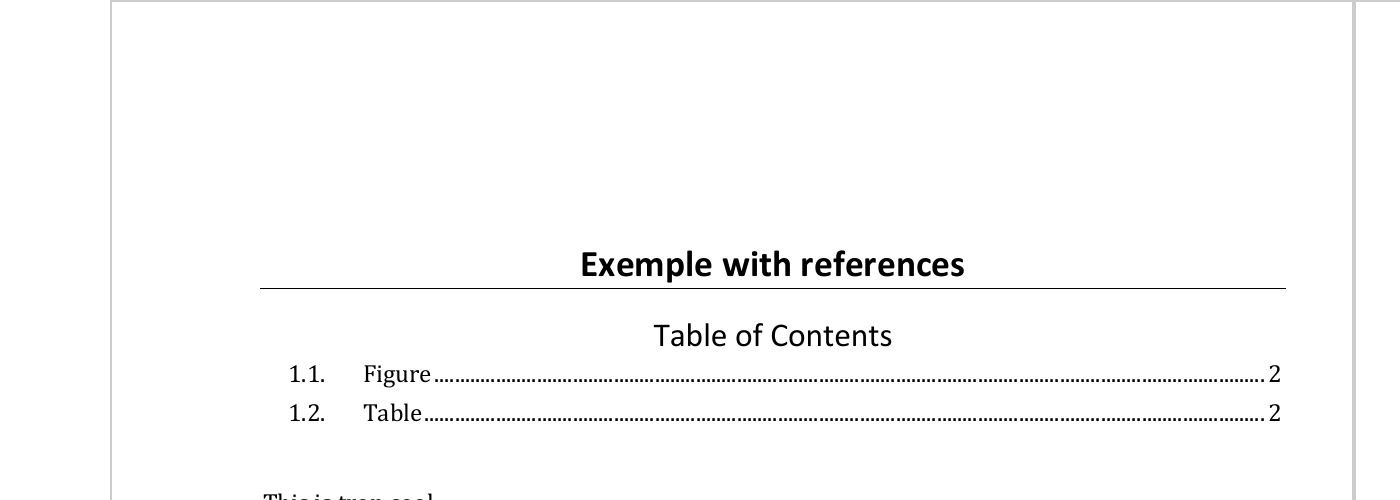
New features of the ‘doconv’ package: how to update all fields and table of contents of a Word document using R (and ‘Microsoft Word’). This can also be used to update custom document properties after setting them in a Word document with package ‘officer’.
2022/08/25
flextable 0.7.2 is out
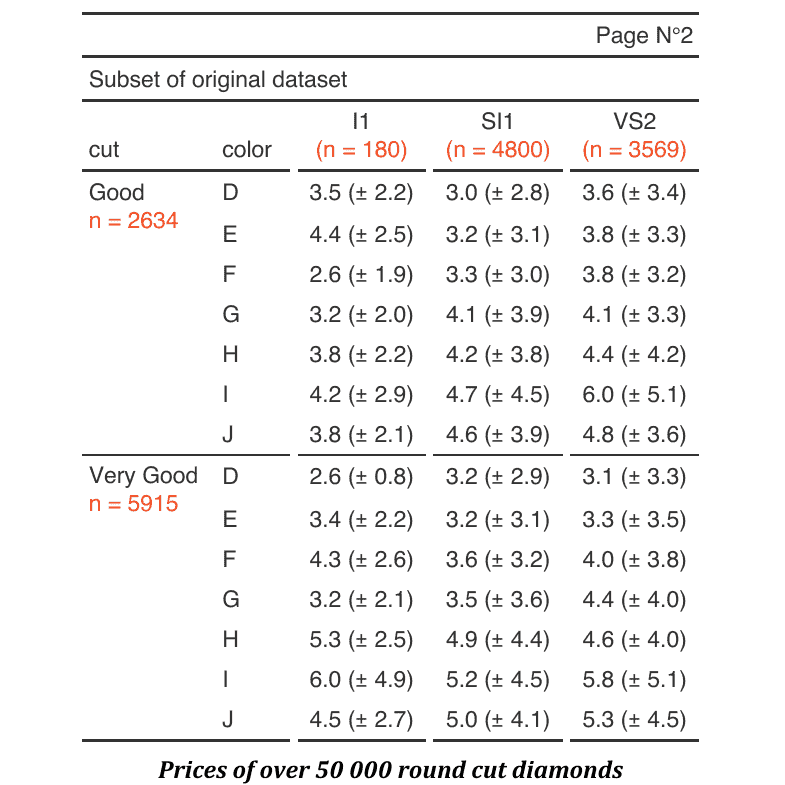
An illustrated summary of the new features of the ‘flextable’ package: how to create crosstabulations of aggregations, how to use flextable for printing data.frame in R Markdown documents and how to split column names into multiple lines.
2022/06/23
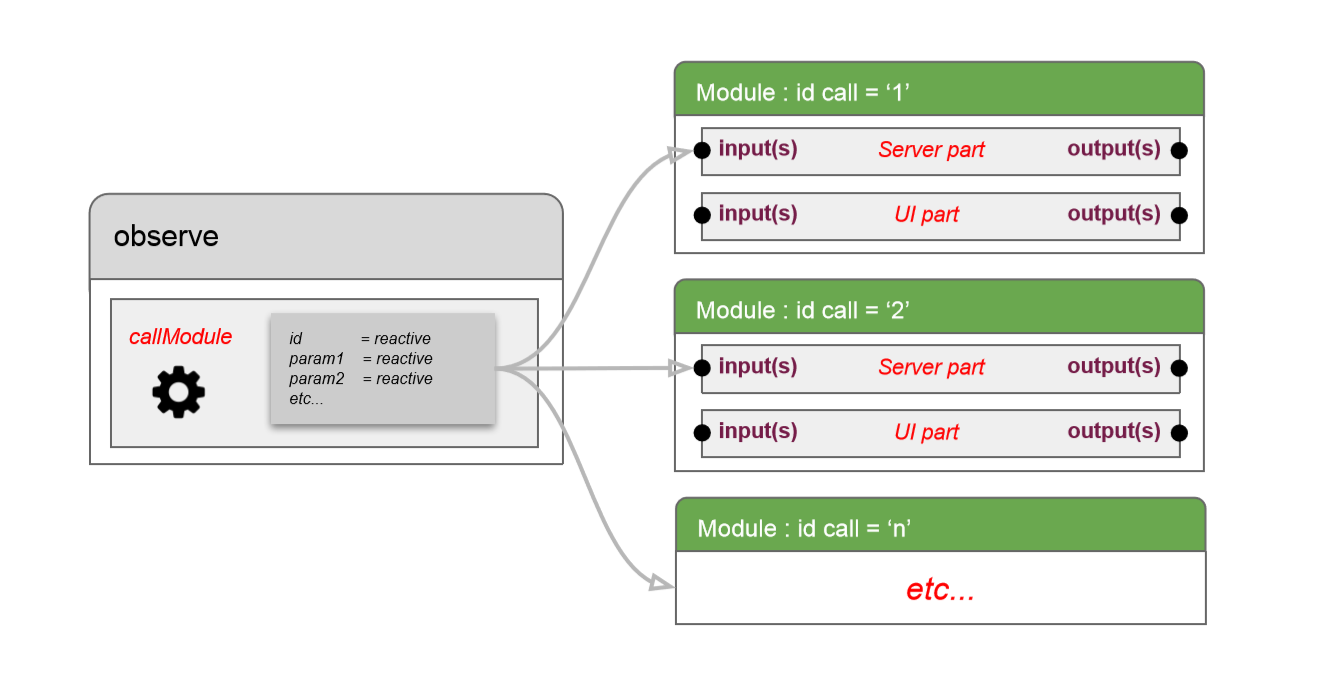
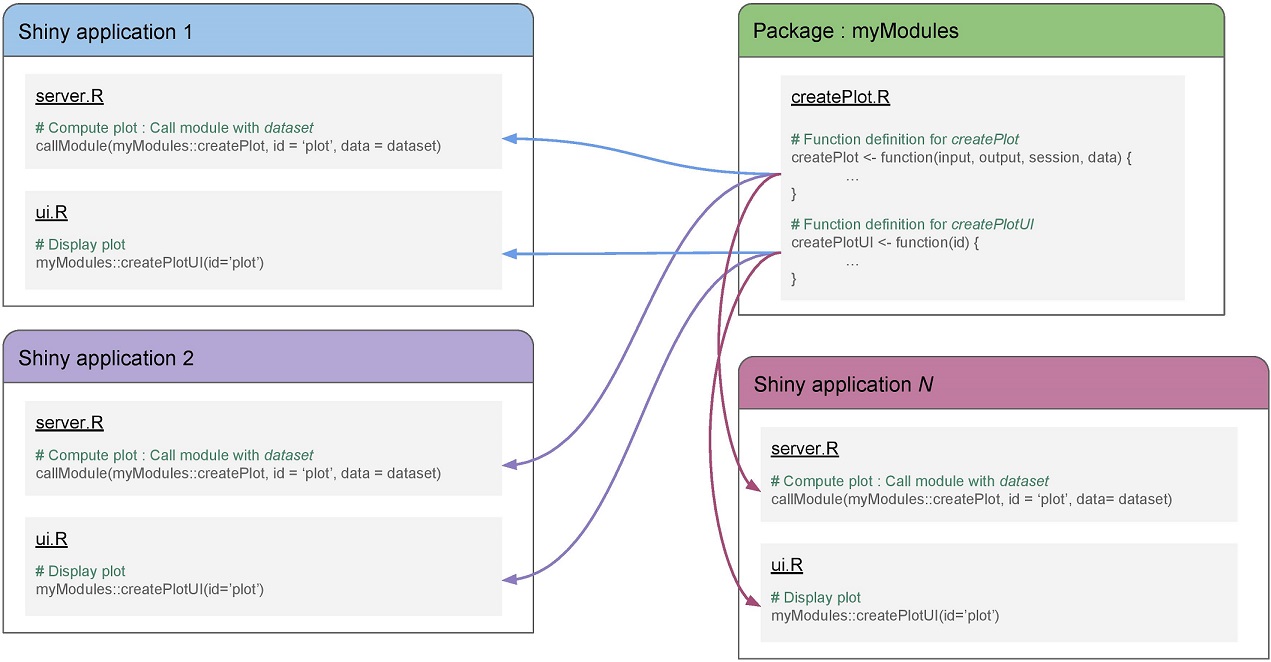
Shiny Modules (part 3): Dynamic module call
News from ggiraph
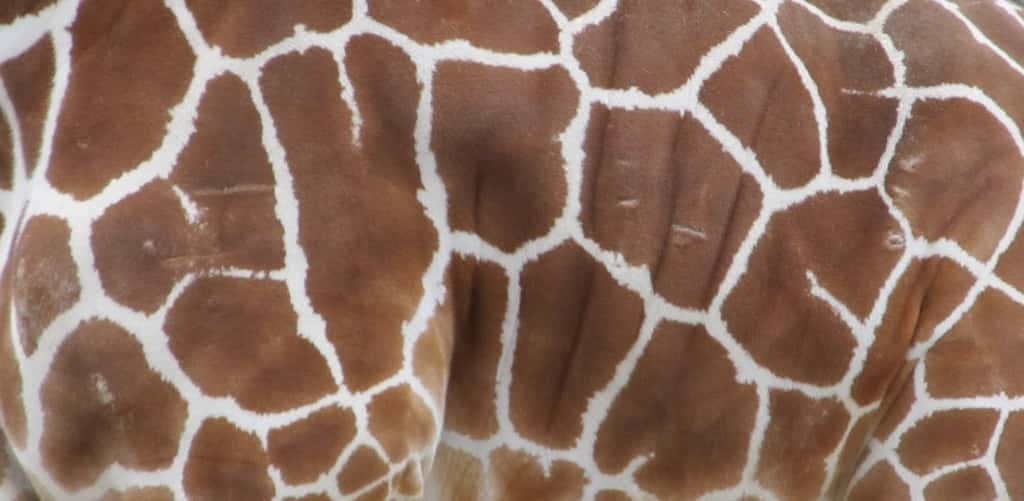
ggiraph has a new syntax easier to use than the old one, the JavaScript code has also been completely modularized. In this post, we are summarising what ggiraph can do and then we are explaining what are the new functionalities.
2019/05/24
Save a flextable as an image
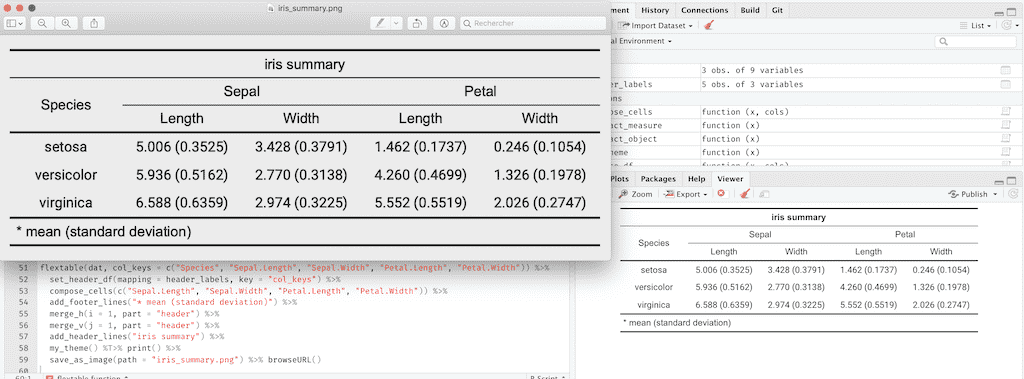
flextable now allows the printing of a table in an image but also in ggplot graphics. This post presents and illustrates these new functionalities.
2019/05/23
Shiny Modules (part 2): Share reactive among multiple modules
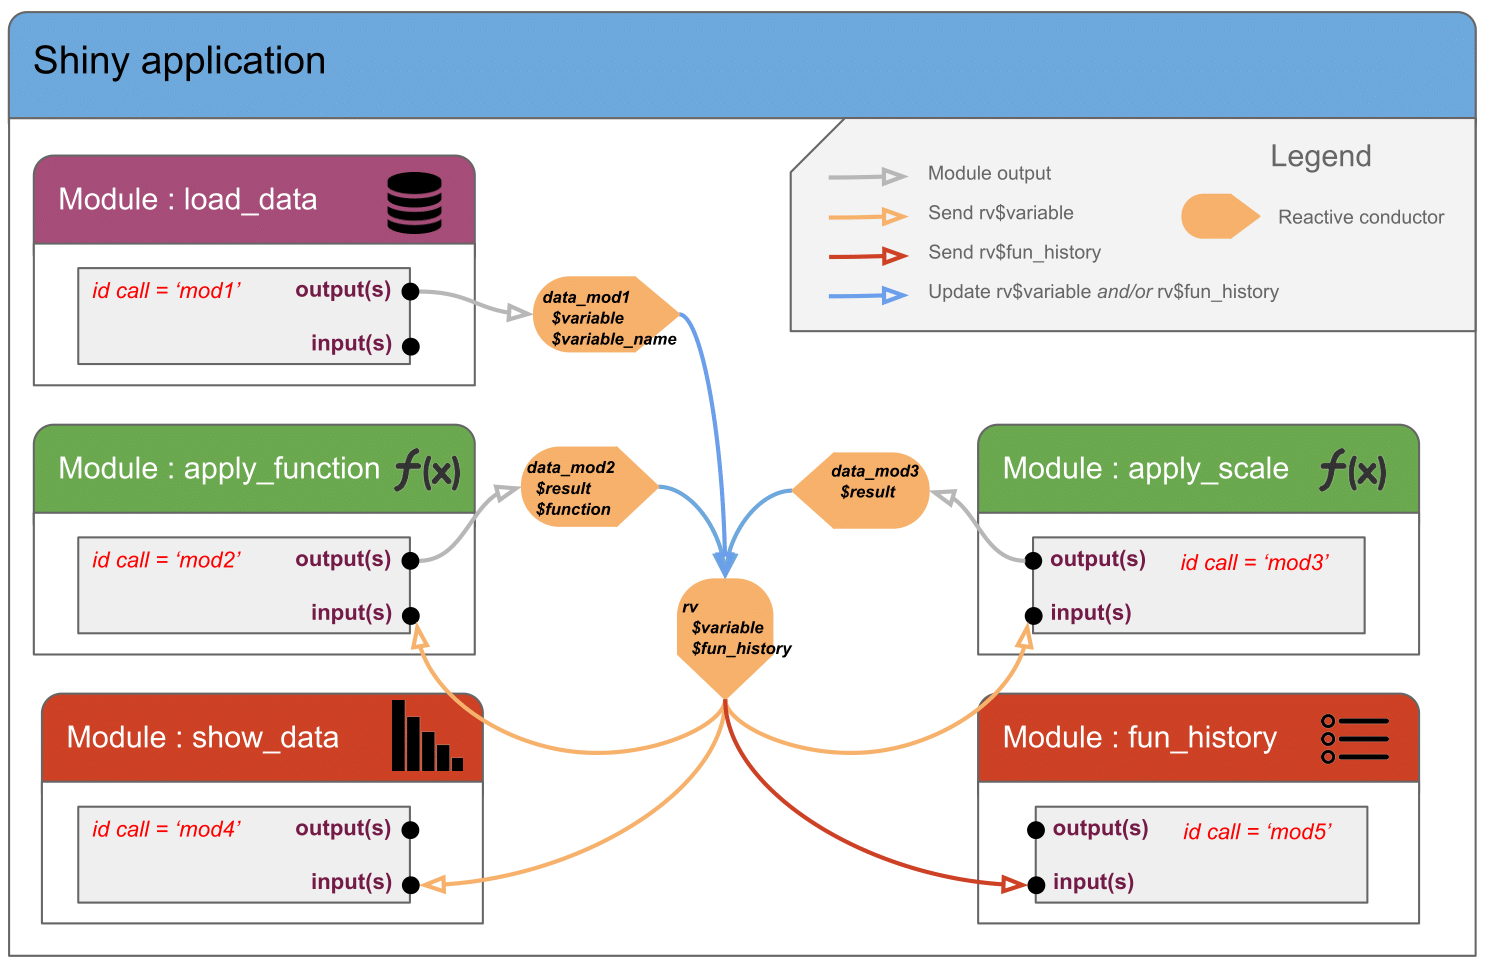
Shiny Modules (part 1) : Why using modules ?
Modules are a nice help to build Shiny applications. Here are some good reasons to use them.
2019/02/11
flextable 0.4.0 is out
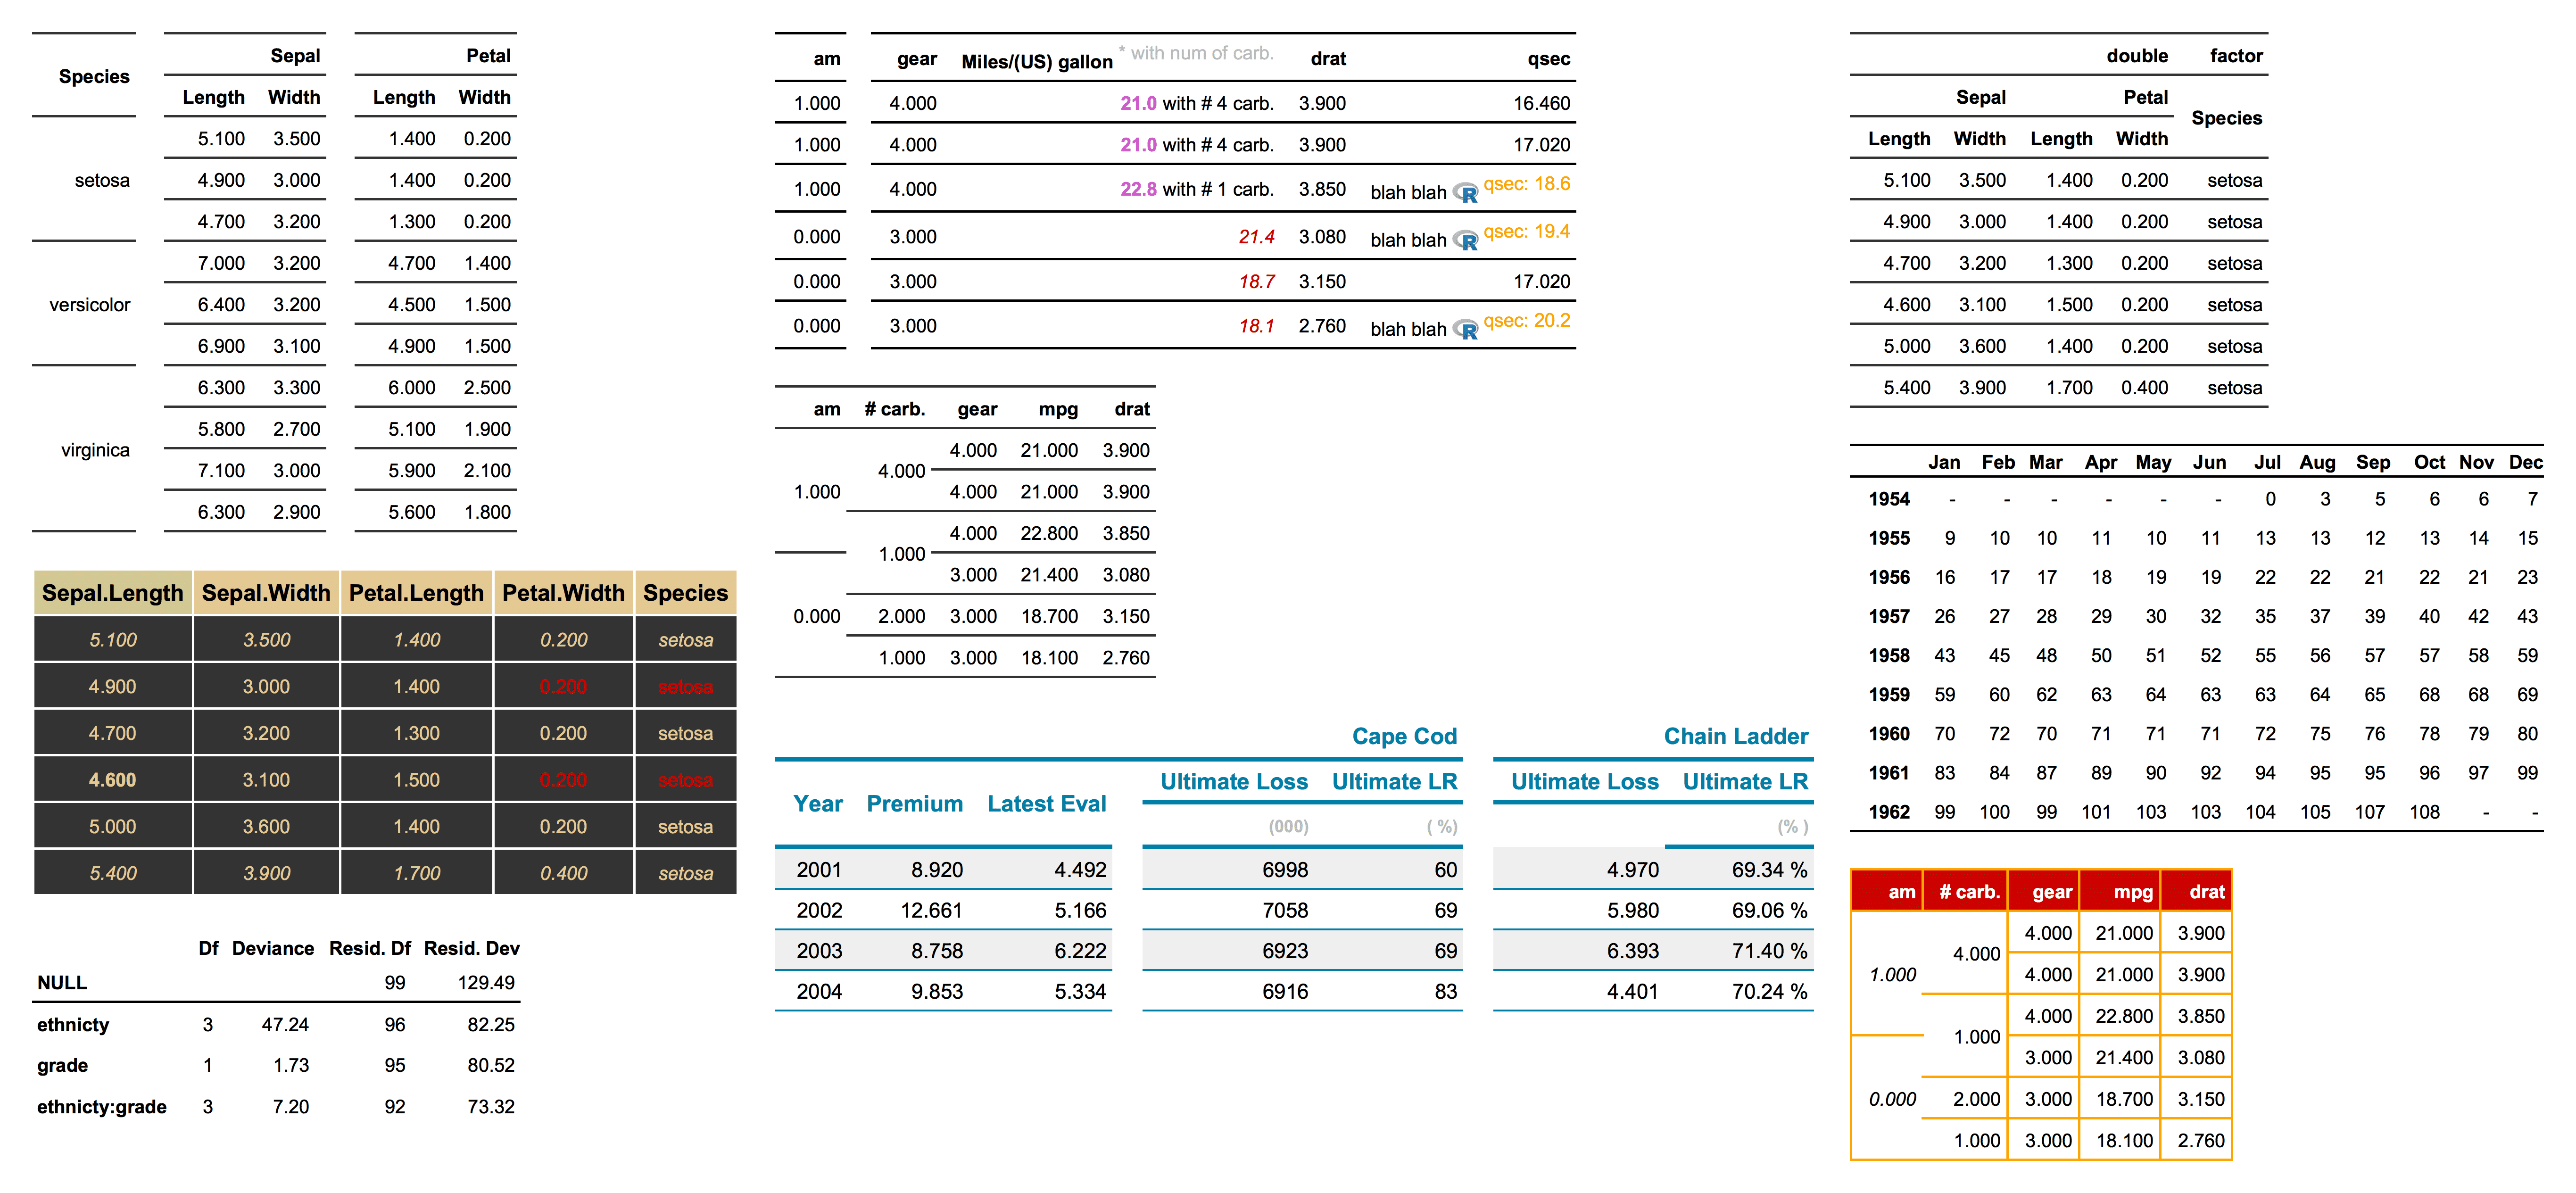
The package flextable is existing since mid 2016 and I did not made any communication about it; obviously if I wrote it, I’d like it to be used by R users! That post is an attempt to fix that. The flextable package makes it simpler to create tables for reporting purposes. The goal of the package is to provide a set of functions that can be used to design and format tabular reporting.
2018/01/11
officer version 0.1.6
It’s time to announce the release of officer version 0.1.6. It allows to generate Microsoft documents from R; supported formats are Word and PowerPoint. It does come with other new packages1: flextable: produces sophisticated tables. rvg: produces vector graphics for PowerPoints mschart: produces native Microsoft charts Package officer is the reboot of ReporteRs. It’s better, faster and does only rely on R.2 Example Let’s have a demo.
2017/09/13
ggiraph 0.3.3 is out
I am excited to announce the release of ggiraph version 0.3.3. The package did not evolved that much within the last months as I was busy on other projects. I finally found time last week to work on it. The new version fixes an issue with pan effect (that was not adjusted to the zoom level). ggiraph() has a new agument ggobj to avoid call to print in the code argument.
2017/03/29
First post

This is my first post. As I am writing packages for R, I should communicate on my work. Until now, I didn’t have correct tool to do it without spending days on it. Thanks to blogdown package from Yihui Xie, I don’t have an excuse anymore…
2017/03/28

