Required packages
library(flextable)
use_df_printer()
The CO2 dataset
The example use datasets::CO2.
CO2[-1]Type | Treatment | conc | uptake |
|---|---|---|---|
factor | factor | numeric | numeric |
Quebec | nonchilled | 95 | 16.0 |
Quebec | nonchilled | 175 | 30.4 |
Quebec | nonchilled | 250 | 34.8 |
Quebec | nonchilled | 350 | 37.2 |
Quebec | nonchilled | 500 | 35.3 |
Quebec | nonchilled | 675 | 39.2 |
Quebec | nonchilled | 1,000 | 39.7 |
Quebec | nonchilled | 95 | 13.6 |
Quebec | nonchilled | 175 | 27.3 |
Quebec | nonchilled | 250 | 37.1 |
n: 84 | |||
The summarizor object
The object returned by summarizor() is an data.frame restructured
so that it can be used as input by tabulator().
obj <- summarizor(CO2[-1], by = "Treatment", overall_label = "Overall")
objvariable | stat | cts | percent | data_type | value1 | value2 | Treatment |
|---|---|---|---|---|---|---|---|
factor | factor | numeric | numeric | character | numeric | numeric | factor |
Type | Quebec | 21 | 0.5 | discrete | nonchilled | ||
Type | Mississippi | 21 | 0.5 | discrete | nonchilled | ||
Type | missing | 0 | 0.0 | discrete | nonchilled | ||
conc | mean_sd | continuous | 435.0 | 297.7 | nonchilled | ||
conc | median_iqr | continuous | 350.0 | 500.0 | nonchilled | ||
conc | range | continuous | 95.0 | 1,000.0 | nonchilled | ||
conc | missing | 0 | 0.0 | continuous | nonchilled | ||
uptake | mean_sd | continuous | 30.6 | 9.7 | nonchilled | ||
uptake | median_iqr | continuous | 31.3 | 12.2 | nonchilled | ||
uptake | range | continuous | 10.6 | 45.5 | nonchilled | ||
n: 33 | |||||||
The flextable
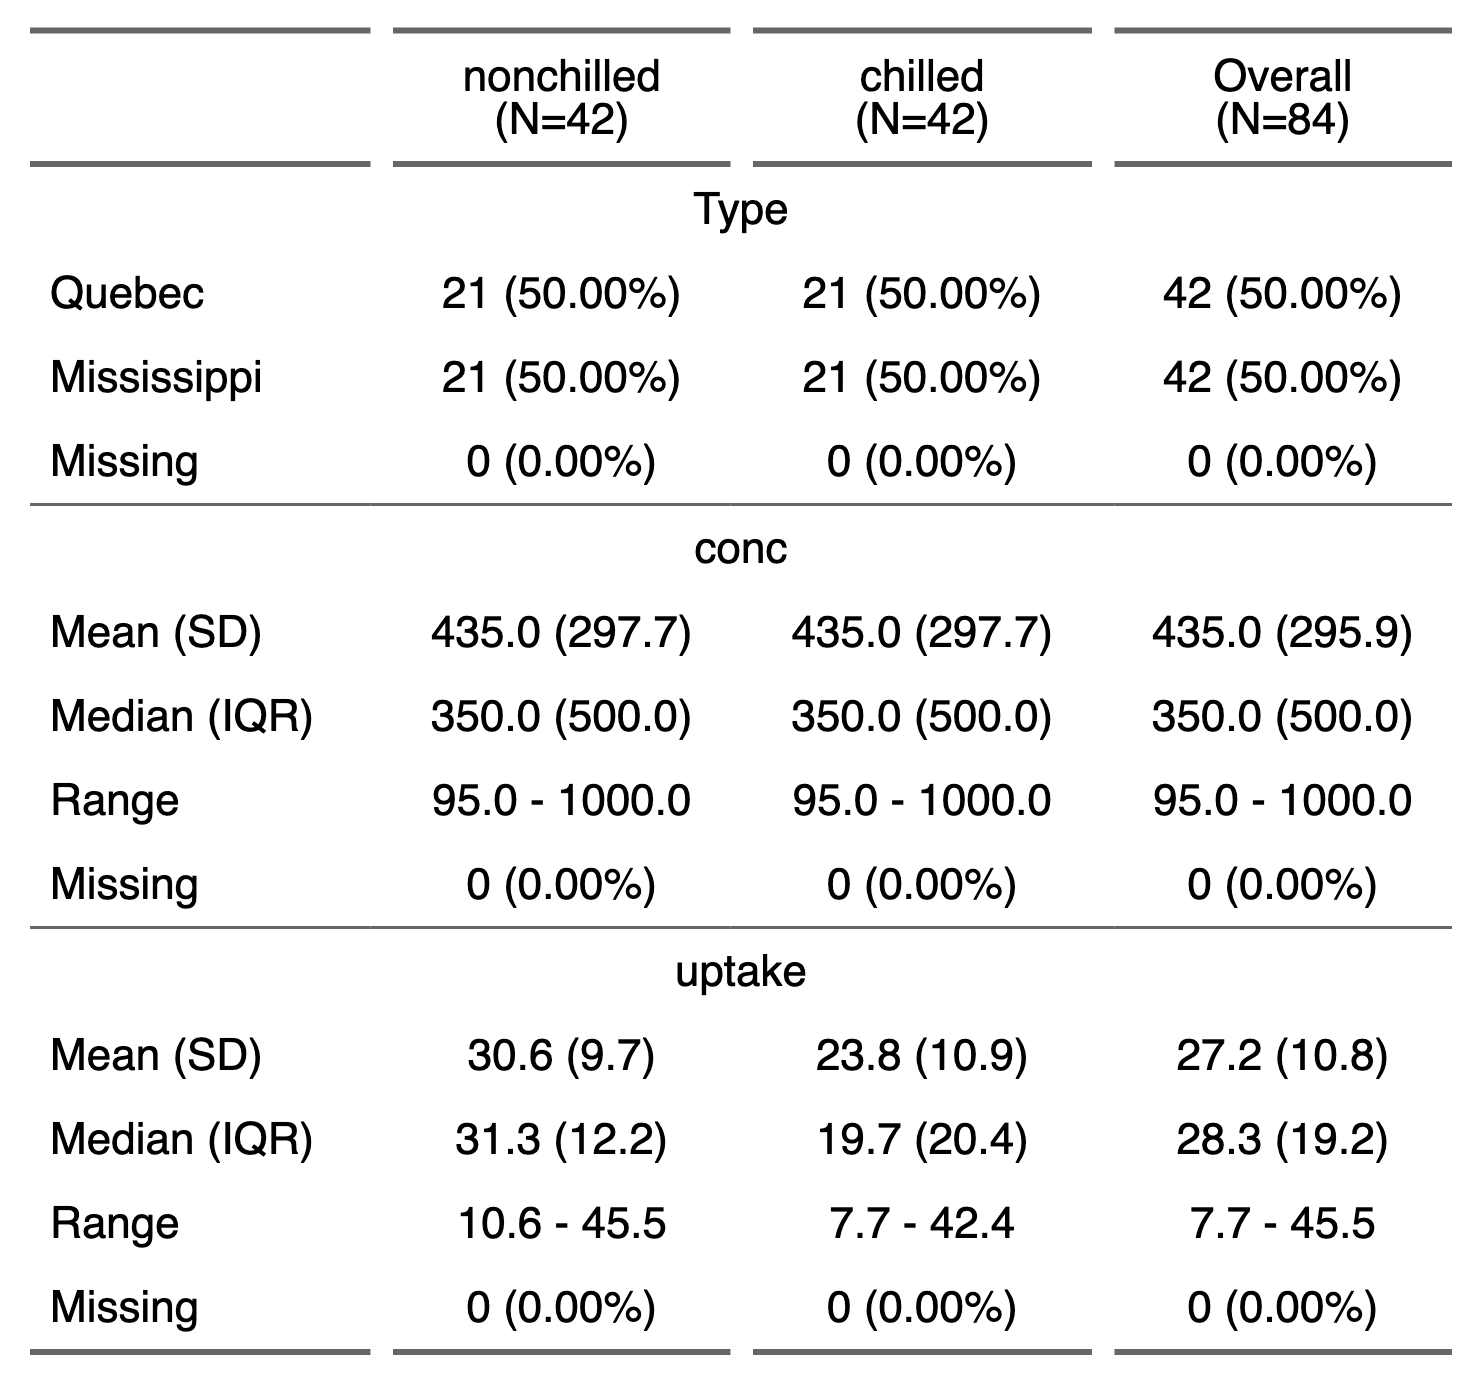
Let’s now create a cross-table of this summary by calling
as_flextable().
ft <- as_flextable(obj, spread_first_col = TRUE, separate_with = "variable")
ftnonchilled | chilled | Overall | ||||
|---|---|---|---|---|---|---|
Type | ||||||
Quebec | 21 (50.00%) | 21 (50.00%) | 42 (50.00%) | |||
Mississippi | 21 (50.00%) | 21 (50.00%) | 42 (50.00%) | |||
Missing | 0 (0.00%) | 0 (0.00%) | 0 (0.00%) | |||
conc | ||||||
Mean (SD) | 435.0 (297.7) | 435.0 (297.7) | 435.0 (295.9) | |||
Median (IQR) | 350.0 (500.0) | 350.0 (500.0) | 350.0 (500.0) | |||
Range | 95.0 - 1000.0 | 95.0 - 1000.0 | 95.0 - 1000.0 | |||
Missing | 0 (0.00%) | 0 (0.00%) | 0 (0.00%) | |||
uptake | ||||||
Mean (SD) | 30.6 (9.7) | 23.8 (10.9) | 27.2 (10.8) | |||
Median (IQR) | 31.3 (12.2) | 19.7 (20.4) | 28.3 (19.2) | |||
Range | 10.6 - 45.5 | 7.7 - 42.4 | 7.7 - 45.5 | |||
Missing | 0 (0.00%) | 0 (0.00%) | 0 (0.00%) | |||
