Packages
library(flextable)
library(charlatan)
The dataset
Let’s simulate a fake dataset with package {charlatan}.
set.seed(007)

n <- 10
people <- data.frame(
  name = ch_name(n = n, locale = "fr_FR"),
  birthday = as.Date(as.POSIXct(unlist(ch_date_time(n = n)), origin = "1970-01-01")) + 20*365,
  n_children = as.integer(ch_integer(n = n, min = 0, max = 4)),
  money = rnorm(n = n, mean = 500, sd = 22),
  weight = runif(n = n, min = 50, max = 90),
  height = rnorm(n = n, mean = 170, sd = 5),
  n_peanuts = ch_integer(n = n, min = 500000, max = 1225193),
  eye_color = as.factor(sample(c("blue", "green", "dark"), prob = c(.15, .3, .55), size = n, replace = TRUE)),
  stringsAsFactors = FALSE
)
people[2:4, 4] <- NA_real_
Flextable
Setting defaults
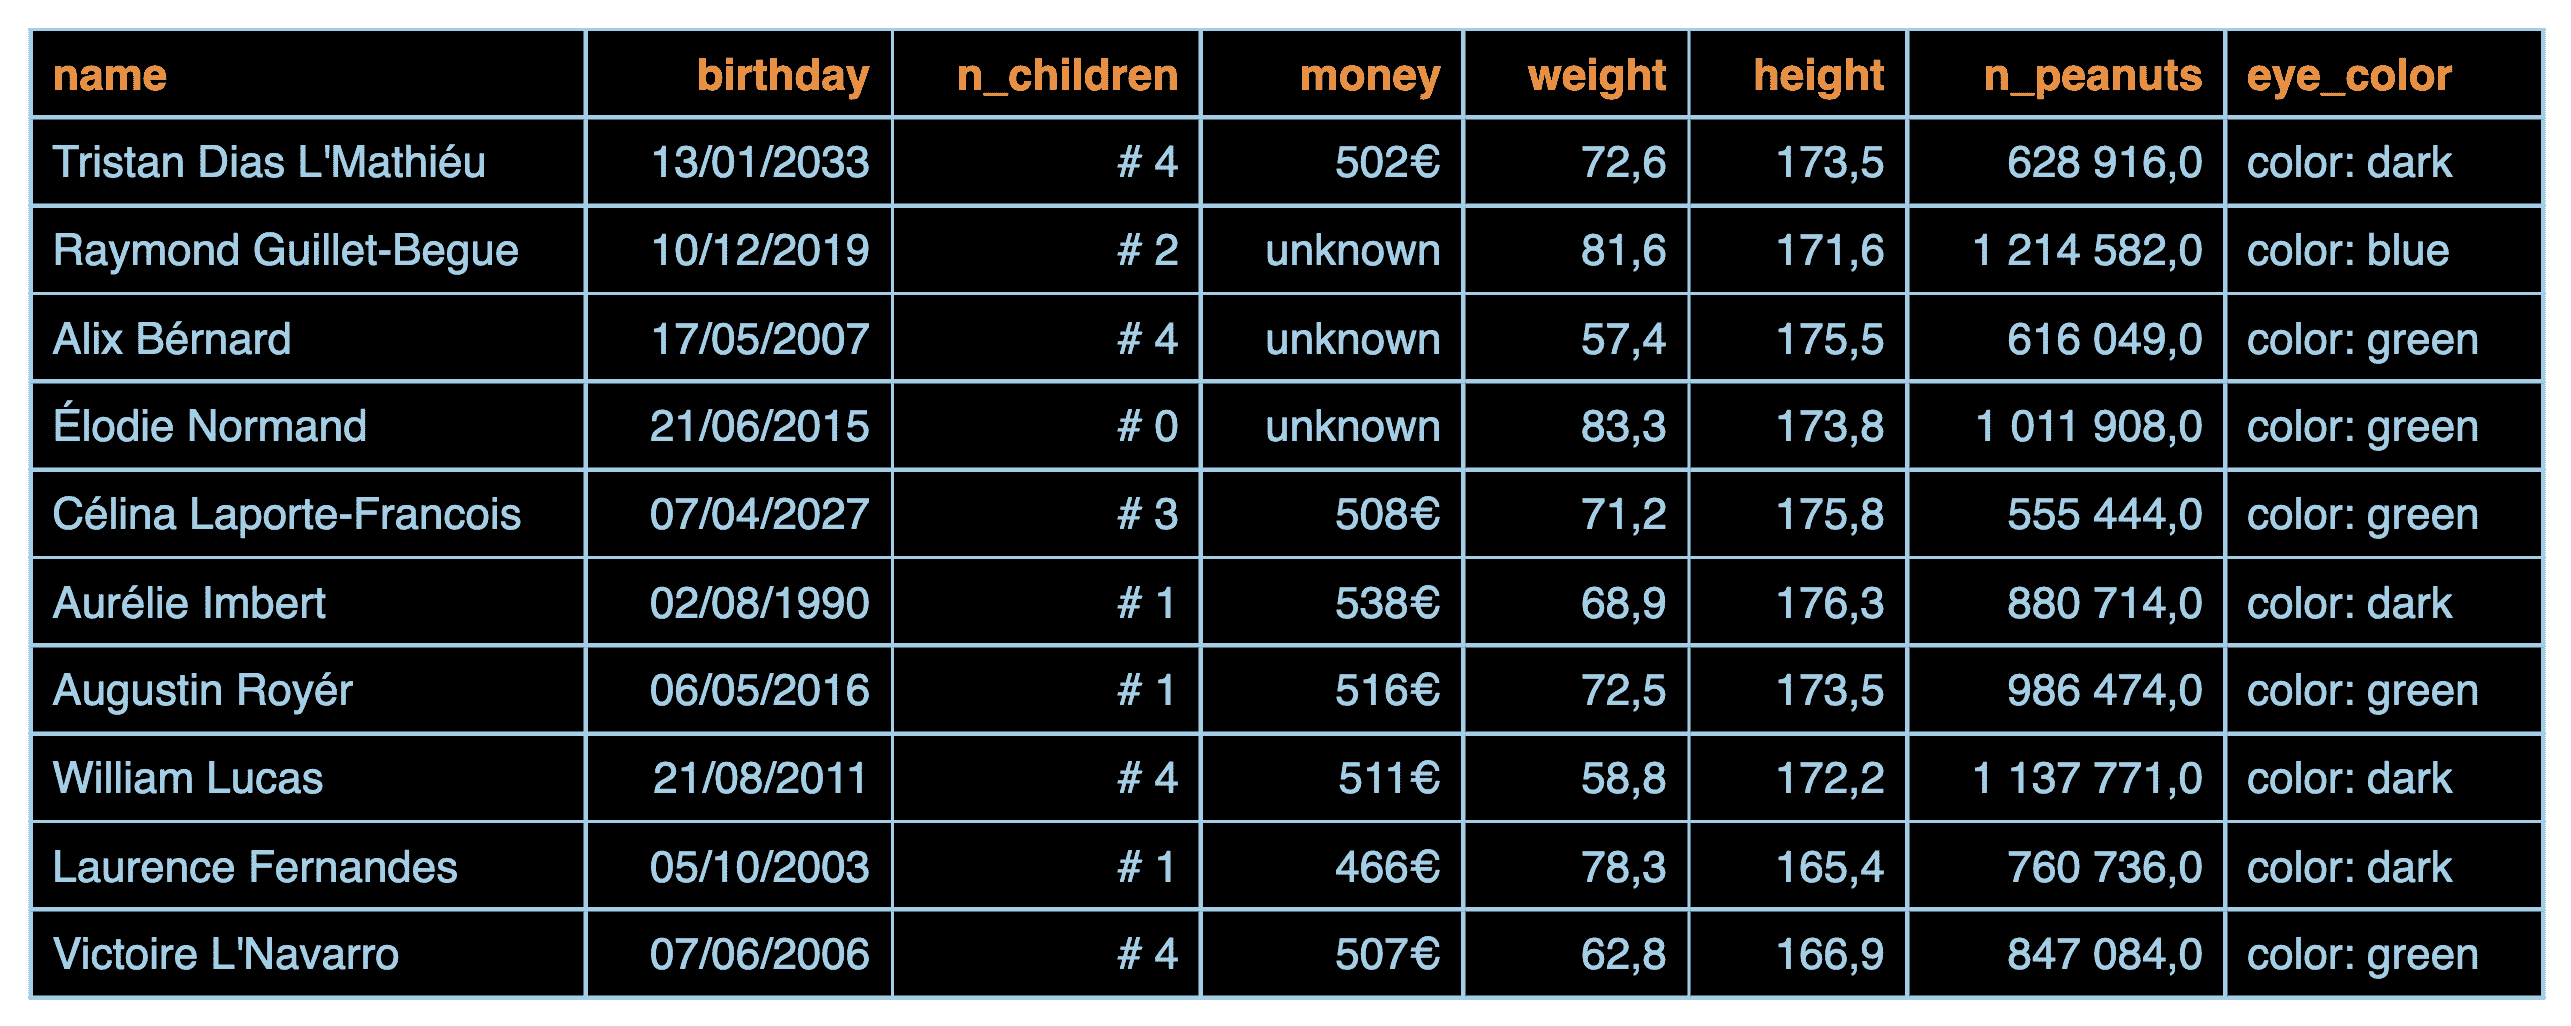
First, let’s define a post-processing operation that will customize the HTML display. This function will be executed systematically before printing the table.
set_flextable_defaults(
  post_process_html = function(x){
    theme_tron(x) |> autofit()
  }
)
Define how to display cell content
Now we can focus on how to format the content of the cells.
colformat_* functions are dedicated to this task.
ft <- flextable(people) |>
  colformat_double(digits = 1,
    big.mark = " ", decimal.mark = ",",
    na_str = "na", j = ~ . - money) |>
  colformat_double(digits = 0,
    big.mark = " ",
    suffix = "€",
    na_str = "unknown", j = "money") |>
  colformat_int(j = "n_children", prefix = "# ") |>
  colformat_char(j = "eye_color", prefix = "color: ") |>
  colformat_date(fmt_date = "%d/%m/%Y")
ftname | birthday | n_children | money | weight | height | n_peanuts | eye_color |
Tristan Dias L'Mathiéu | 13/01/2033 | # 4 | 502€ | 72,6 | 173,5 | 628 916,0 | color: dark |
Raymond Guillet-Begue | 10/12/2019 | # 2 | unknown | 81,6 | 171,6 | 1 214 582,0 | color: blue |
Alix Bérnard | 17/05/2007 | # 4 | unknown | 57,4 | 175,5 | 616 049,0 | color: green |
Élodie Normand | 21/06/2015 | # 0 | unknown | 83,3 | 173,8 | 1 011 908,0 | color: green |
Célina Laporte-Francois | 07/04/2027 | # 3 | 508€ | 71,2 | 175,8 | 555 444,0 | color: green |
Aurélie Imbert | 02/08/1990 | # 1 | 538€ | 68,9 | 176,3 | 880 714,0 | color: dark |
Augustin Royér | 06/05/2016 | # 1 | 516€ | 72,5 | 173,5 | 986 474,0 | color: green |
William Lucas | 21/08/2011 | # 4 | 511€ | 58,8 | 172,2 | 1 137 771,0 | color: dark |
Laurence Fernandes | 05/10/2003 | # 1 | 466€ | 78,3 | 165,4 | 760 736,0 | color: dark |
Victoire L'Navarro | 07/06/2006 | # 4 | 507€ | 62,8 | 166,9 | 847 084,0 | color: green |
