library(flextable)
library(magrittr)
In this example, a theme function is created and used to format different data.frame.
A theme function is a R function where input is a flextable and output is a flextable. You are free to do any formatting inside this function.
theme_design <- function(x) {
  x <- border_remove(x)
  std_border <- fp_border_default(width = 4, color = "white")
  x <- fontsize(x, size = 10, part = "all")
  x <- font(x, fontname = "Courier", part = "all")
  x <- align(x, align = "center", part = "all")
  x <- bold(x, bold = TRUE, part = "all")
  x <- bg(x, bg = "#475f77", part = "body")
  x <- bg(x, bg = "#eb5555", part = "header")
  x <- bg(x, bg = "#1bbbda", part = "footer")
  x <- color(x, color = "white", part = "all")
  x <- padding(x, padding = 6, part = "all")
  x <- border_outer(x, part="all", border = std_border )
  x <- border_inner_h(x, border = std_border, part="all")
  x <- border_inner_v(x, border = std_border, part="all")
  x <- set_table_properties(x, layout = "fixed")
  x
}
flextable(head(cars)) %>%
theme_design()speed | dist |
4 | 2 |
4 | 10 |
7 | 4 |
7 | 22 |
8 | 16 |
9 | 10 |
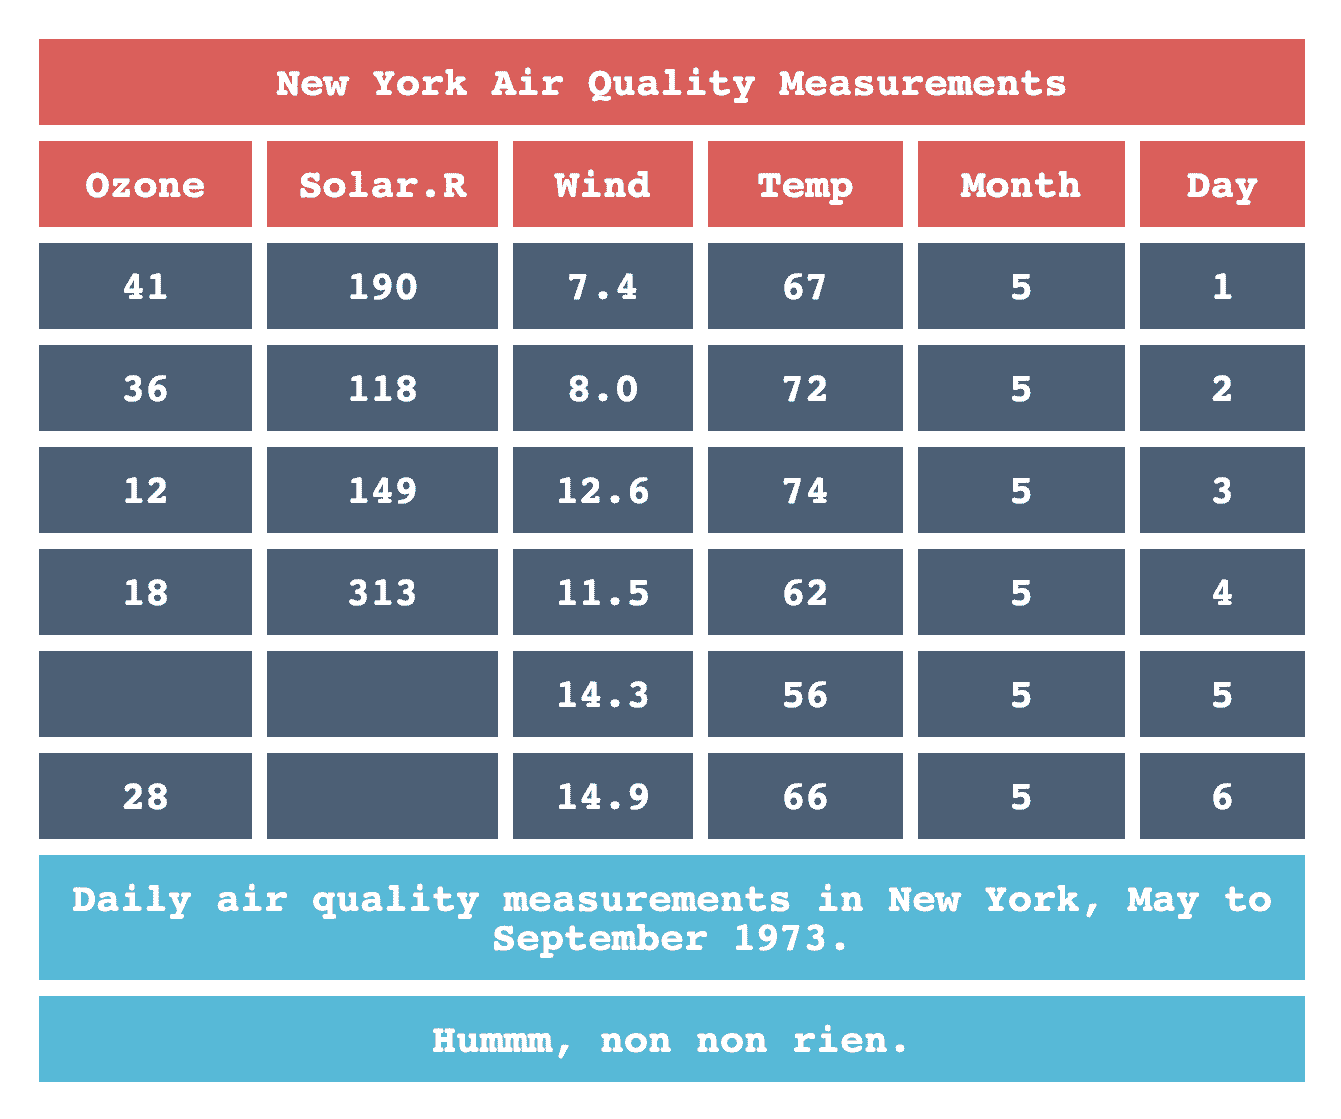
ft <- flextable(head(airquality)) %>%
  add_footer_lines(
    c("Daily air quality measurements in New York, May to September 1973.",
      "Hummm, non non rien.")) %>%
  autofit() %>%
  add_header_lines("New York Air Quality Measurements") %>%
  theme_design()
ftNew York Air Quality Measurements | |||||
Ozone | Solar.R | Wind | Temp | Month | Day |
41 | 190 | 7.4 | 67 | 5 | 1 |
36 | 118 | 8.0 | 72 | 5 | 2 |
12 | 149 | 12.6 | 74 | 5 | 3 |
18 | 313 | 11.5 | 62 | 5 | 4 |
14.3 | 56 | 5 | 5 | ||
28 | 14.9 | 66 | 5 | 6 | |
Daily air quality measurements in New York, May to September 1973. | |||||
Hummm, non non rien. | |||||
